Birdseye Dashboard
A dashboard which shows data for all of the clusters, nodes, namespaces, and deployments in T-Mobile's Kubernetes cloud platform at a high level. There are different views for showing the data. The main dashboard shows the total number of clusters, nodes, namespaces, deployments, pods, and containers in T-Mobile's public cloud platform. The list view shows all of the data for the object which the view is focusing on. For example, the cluster list view shows data for all of the clusters in one sortable list. This list is also used for keeping track of the versions of the components on the cluster. A more detailed view is provided for every instance of a Kubernetes object. This view shows basic identifying data such as ids and labels in addition to everything which can be viewed in the list view.
React is used on the front-end. The primary server is an Express.js server which sends GraphQL queries for all of the clusters, and performs necessary calculations. After performing the calculations, this server caches the data. Next.js is used with React.js to allow for server-side rendering of the pages. By using a combination of Next.js and the Express.js server, I was able to reduce the data load time from 30+ seconds to less than 1 second. Most of the views in the dashboard hold 900+ queries worth of data, and the data is refreshed every 5-10 minutes.
Note: Placeholder data is used for the images below
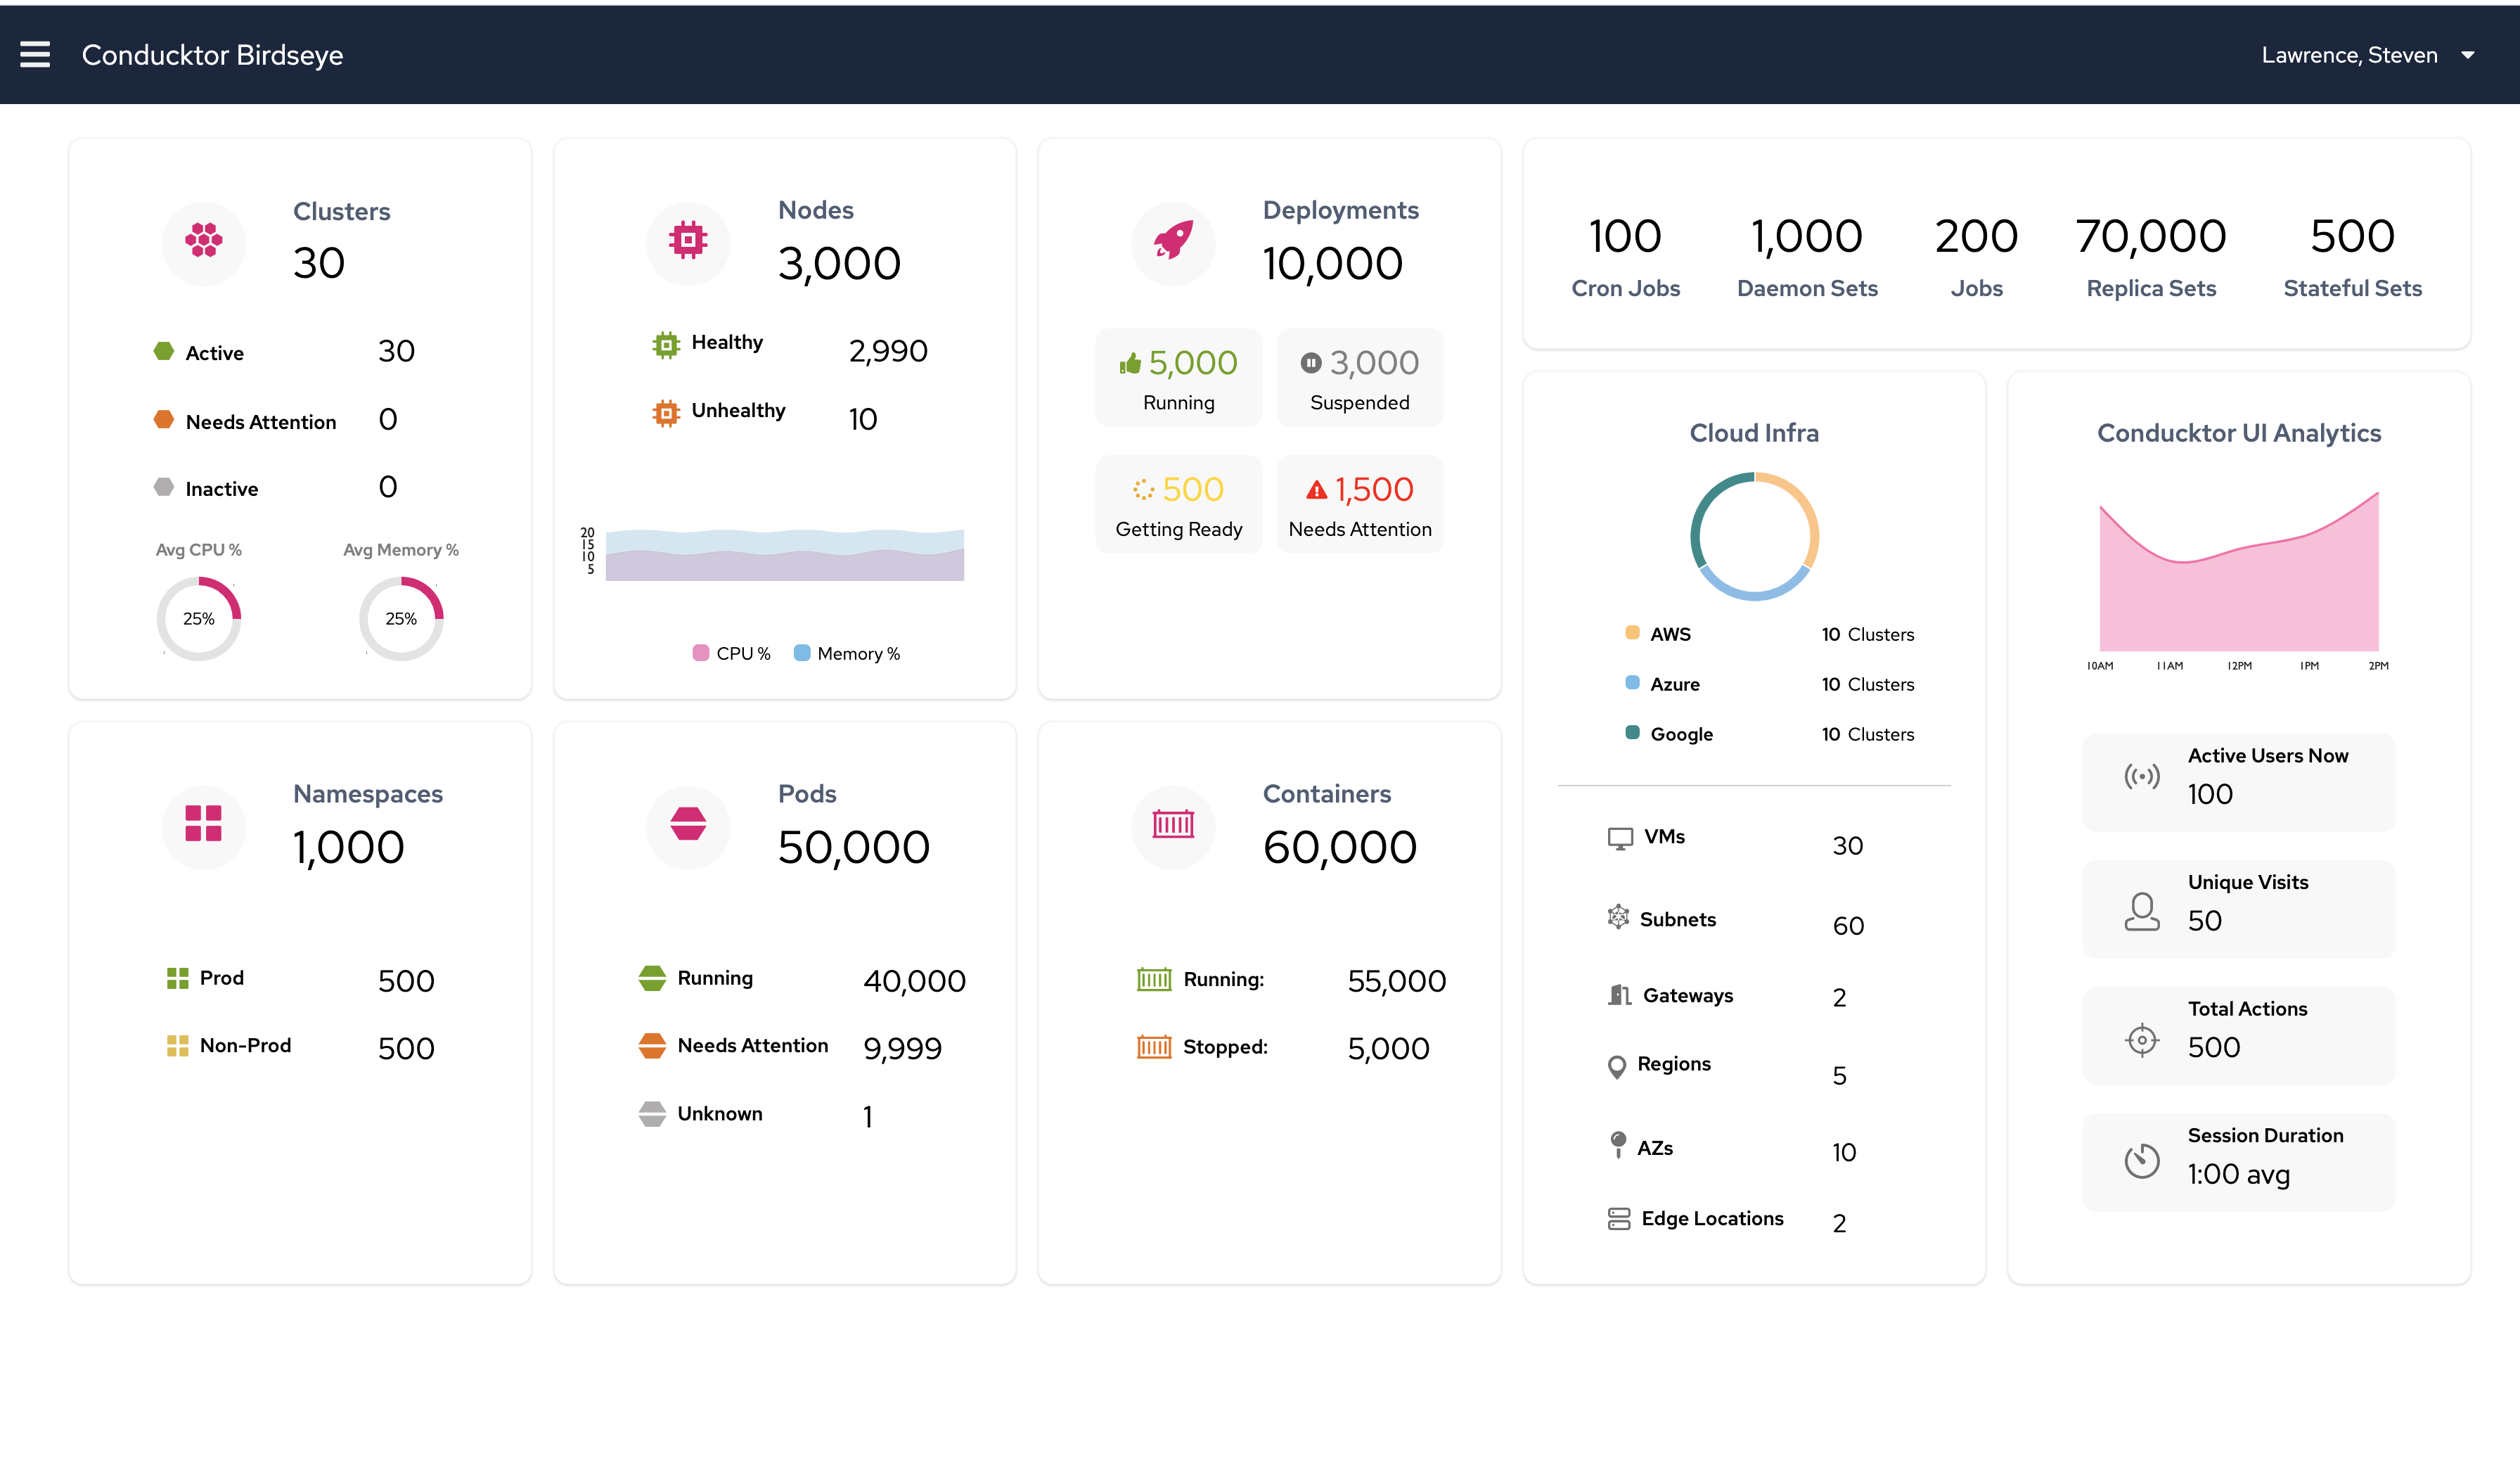
Main dashboard view which shows aggregated totals for all of the data from a very high level. Some of the data is also categorized by status.
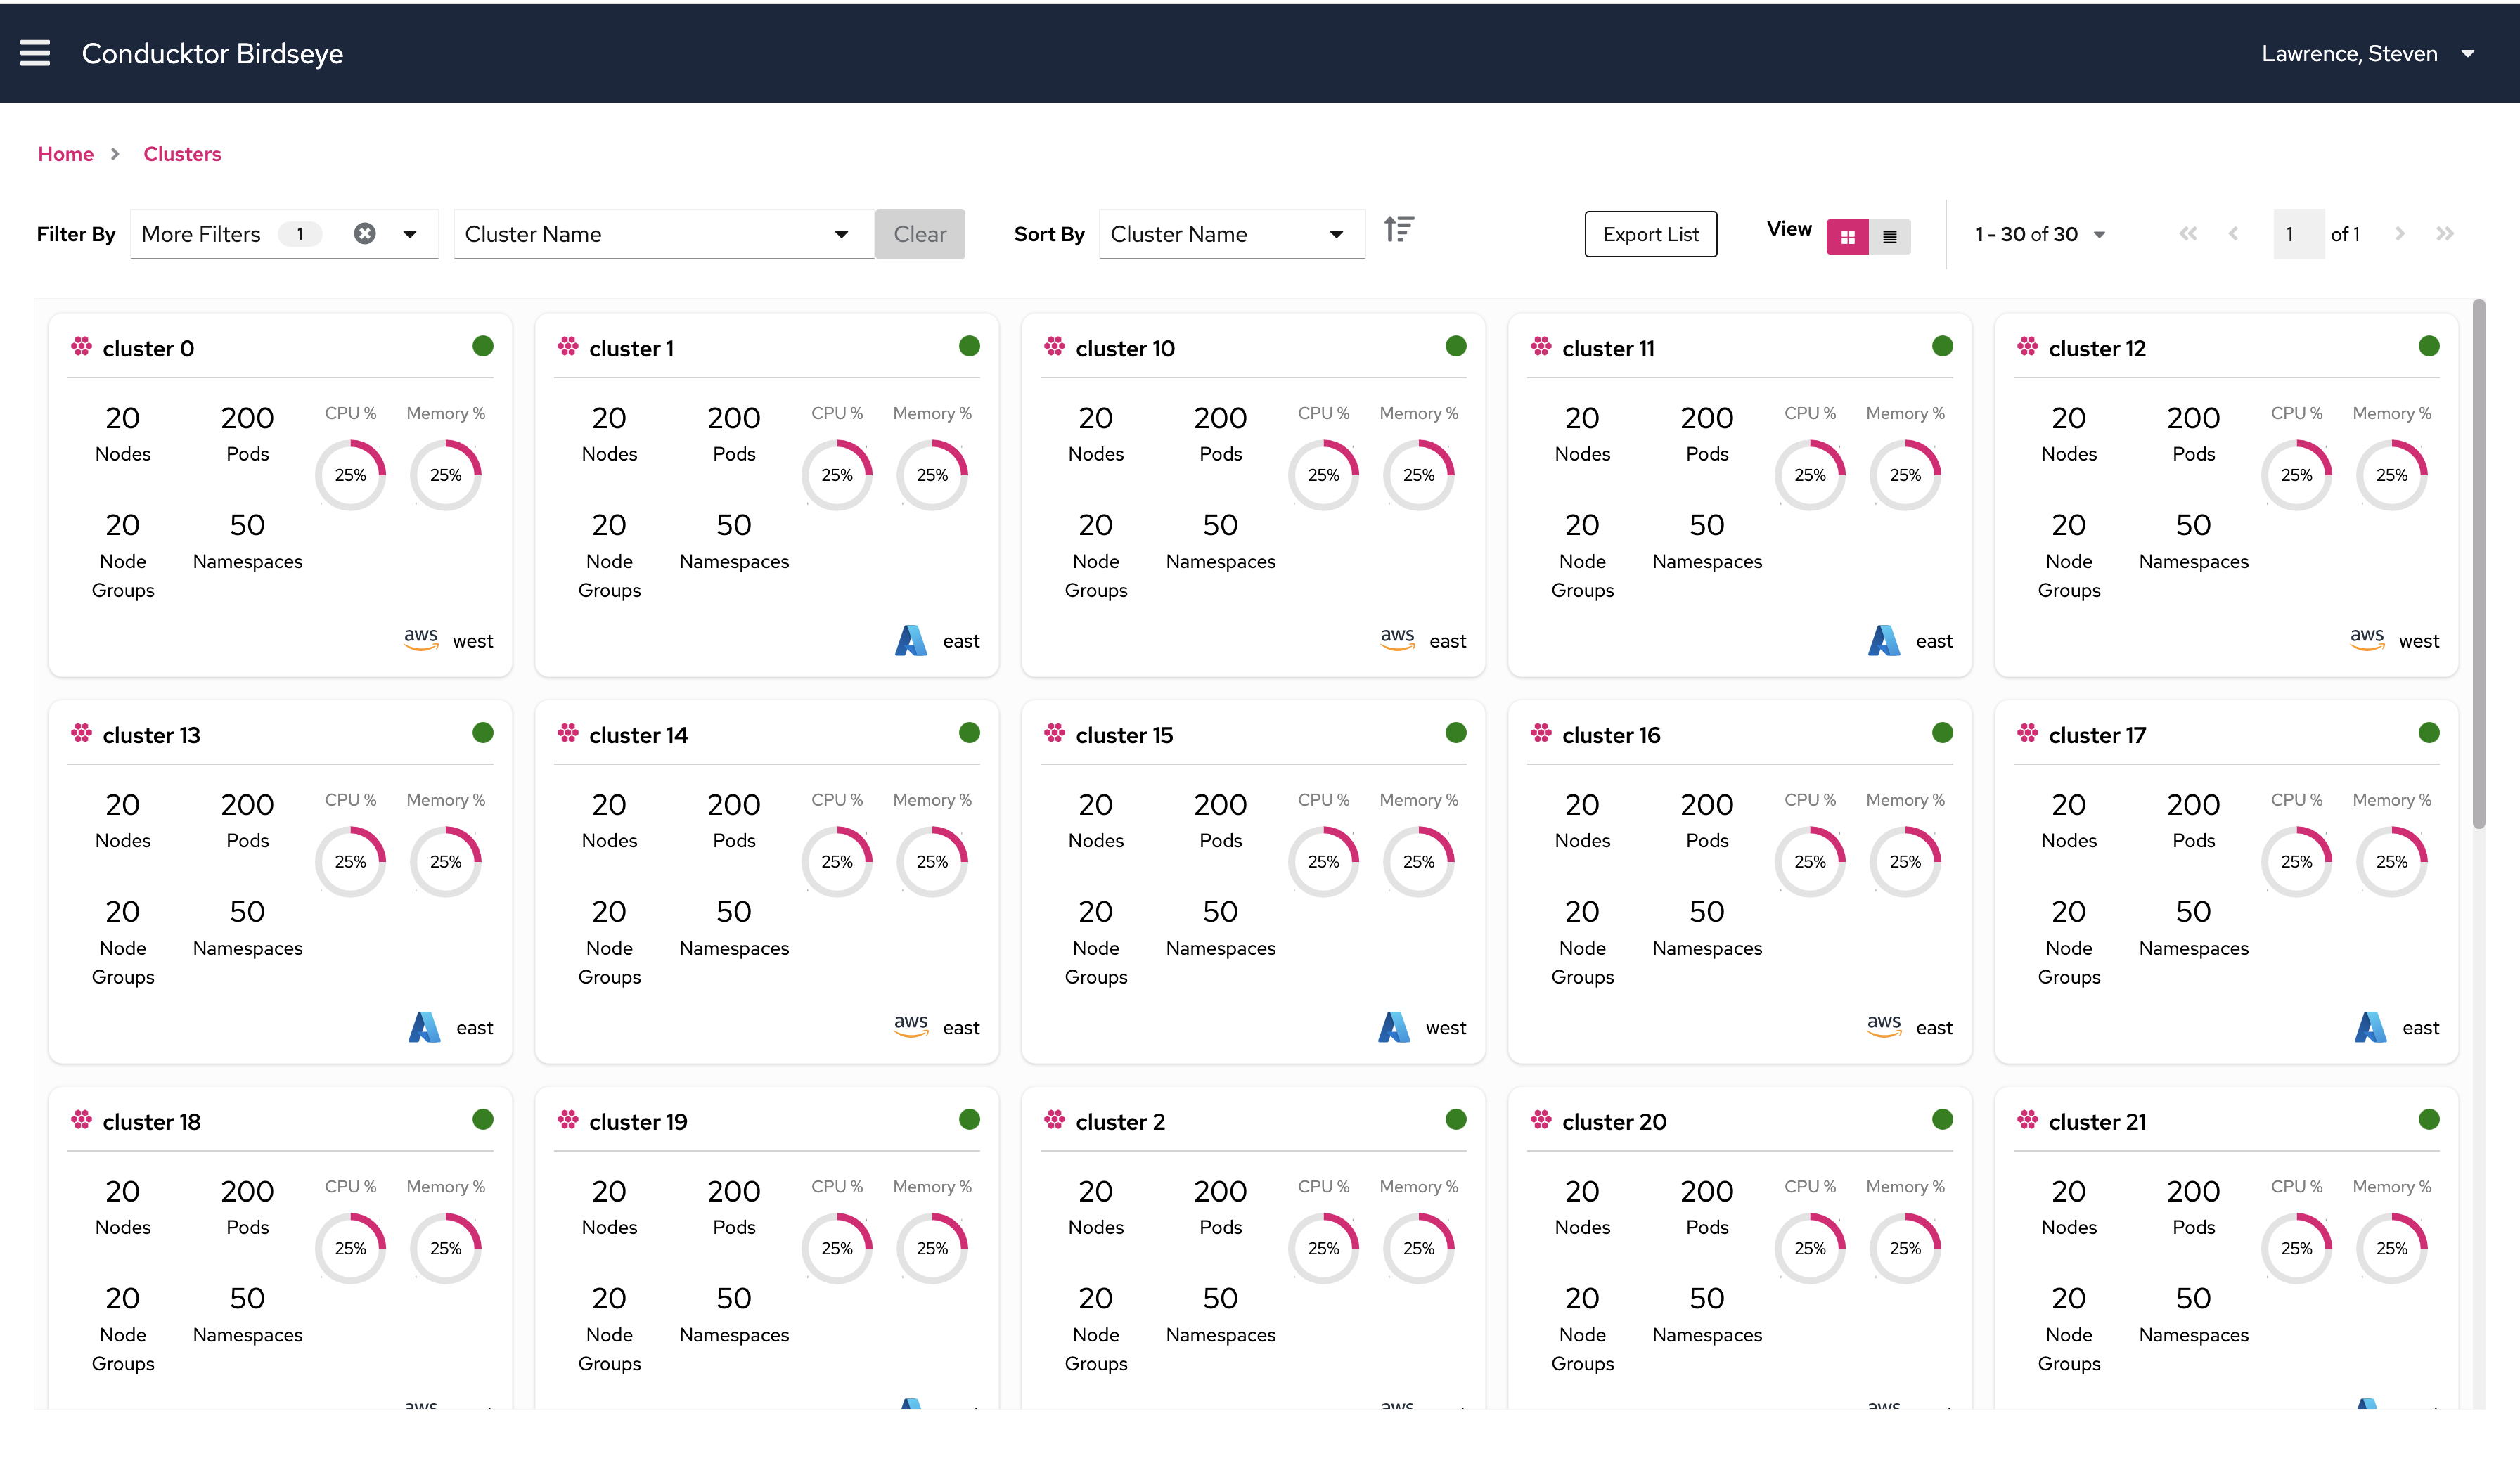
Cluster tile view which represents each cluster in a single tile.
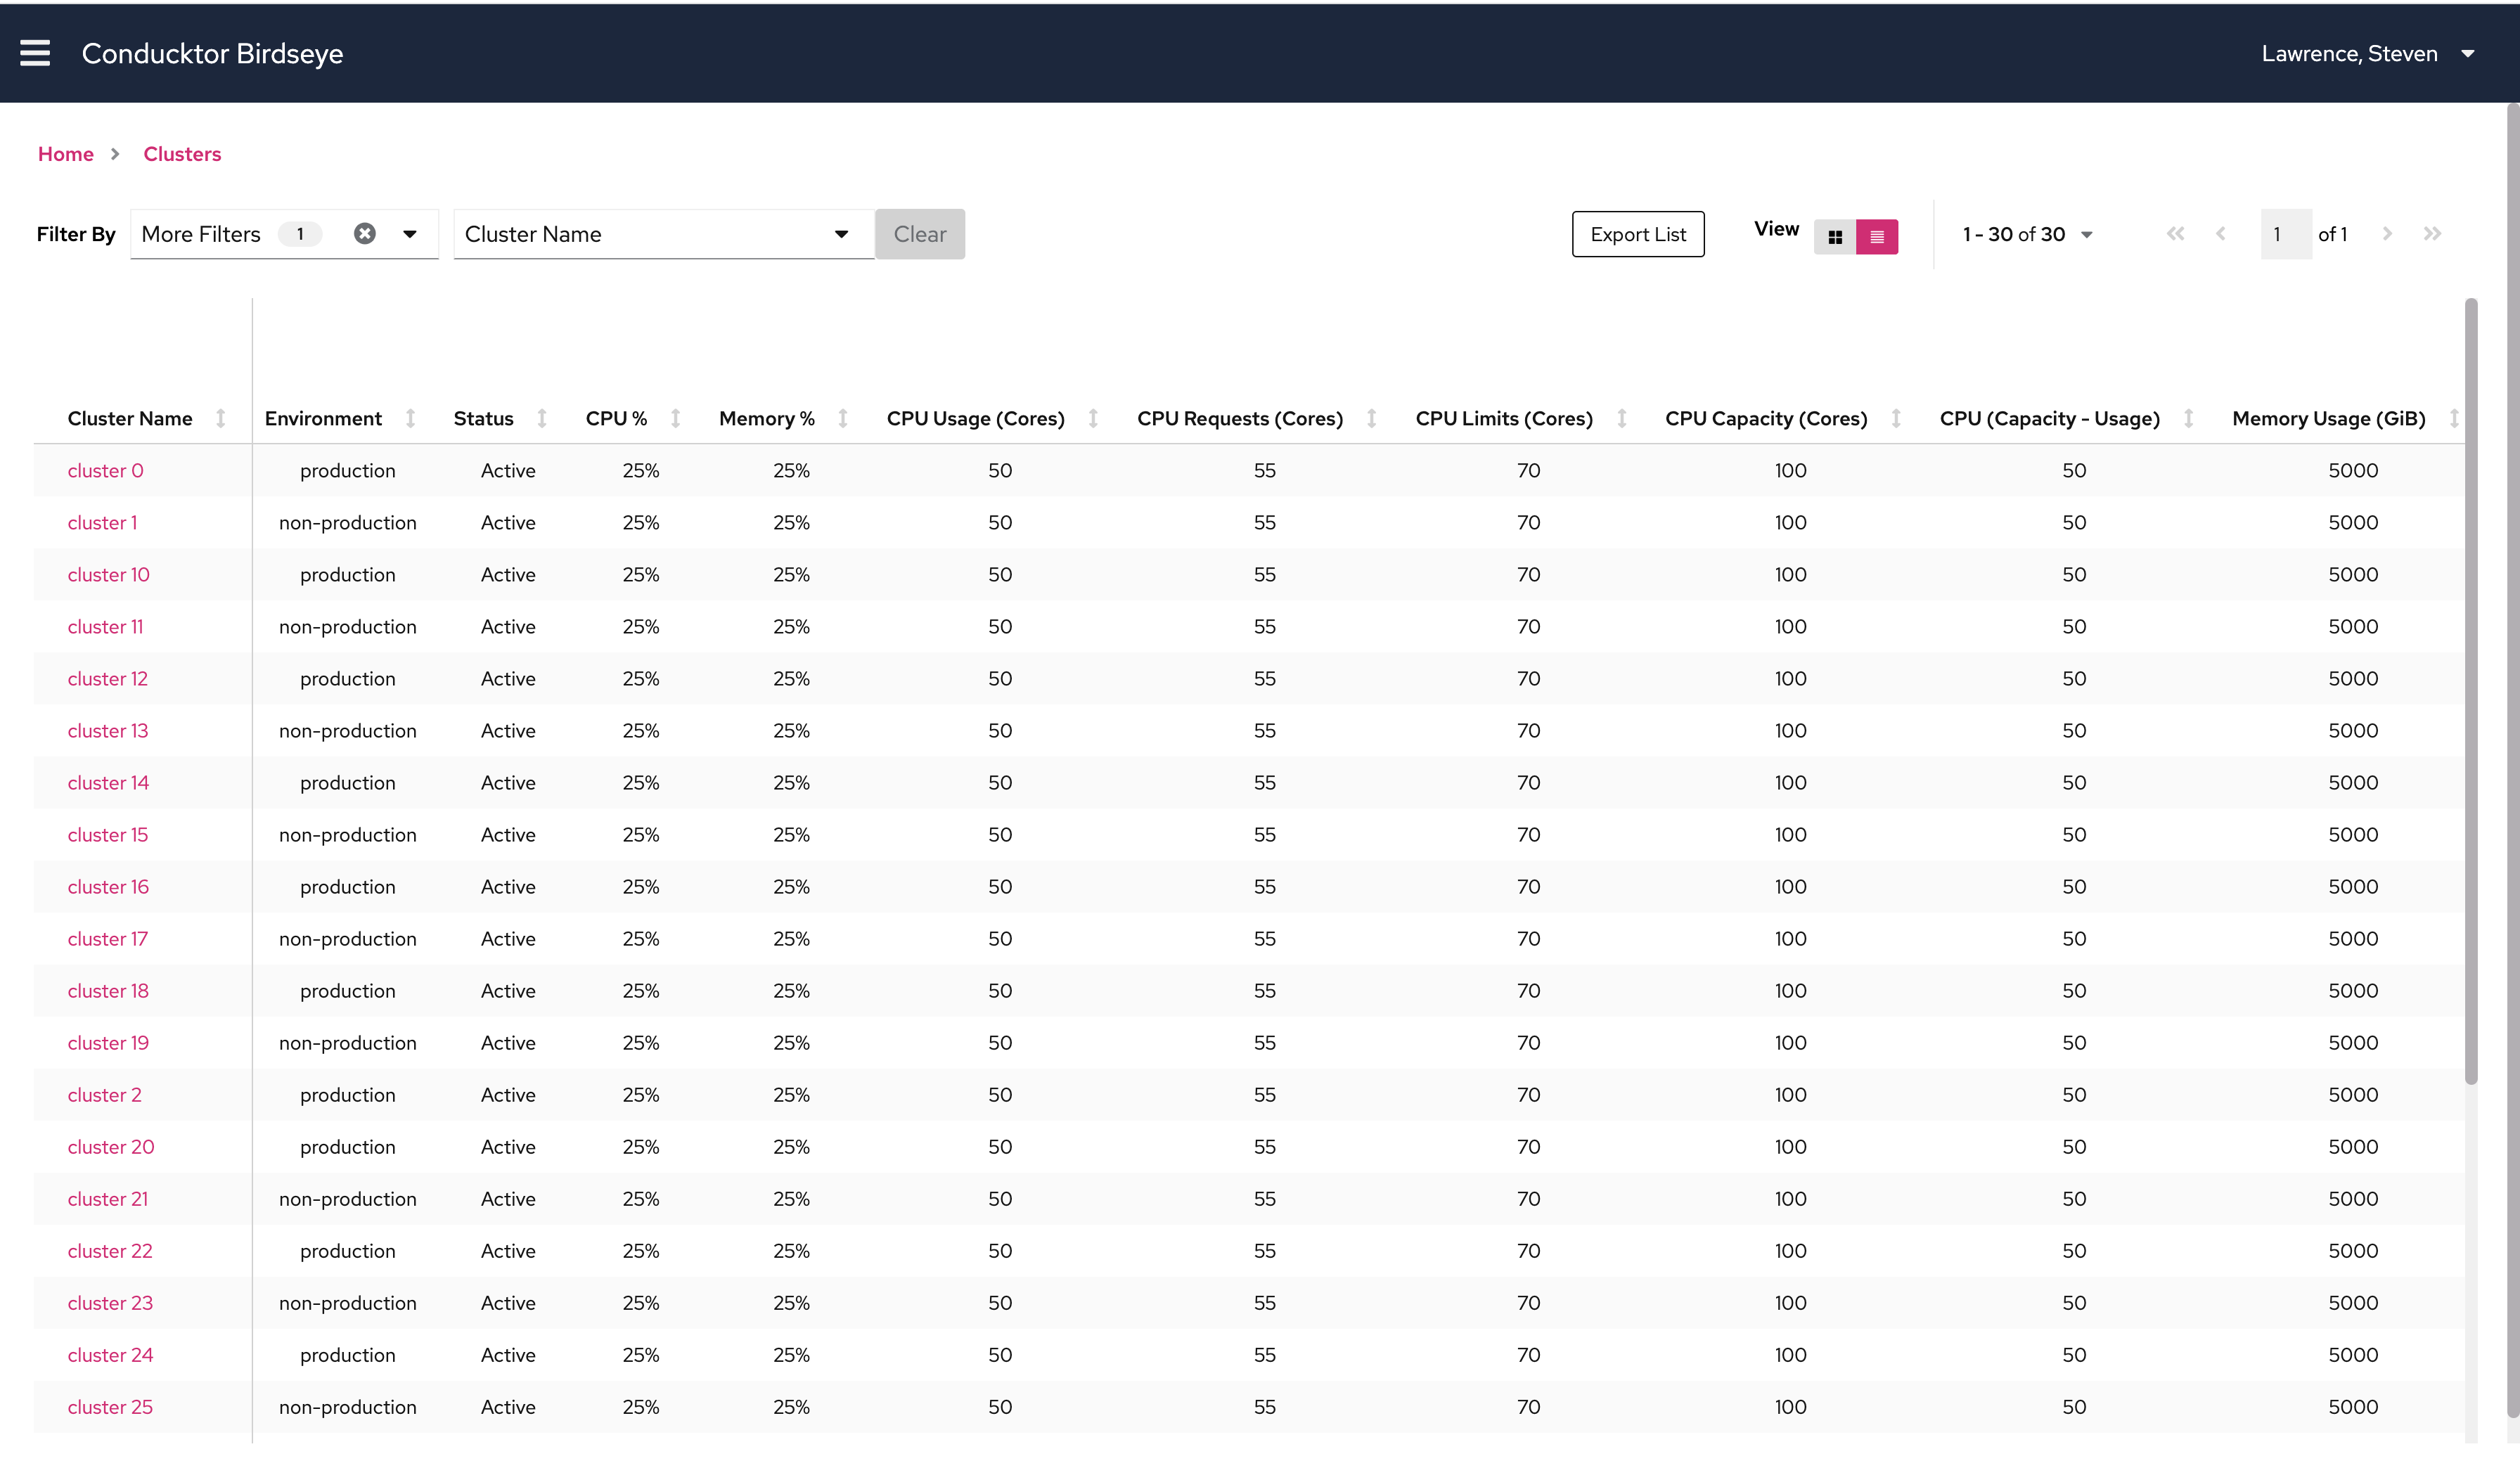
Cluster table view which shows metrics and data for all clusters in a single table. This table holds 900+ queries worth of data
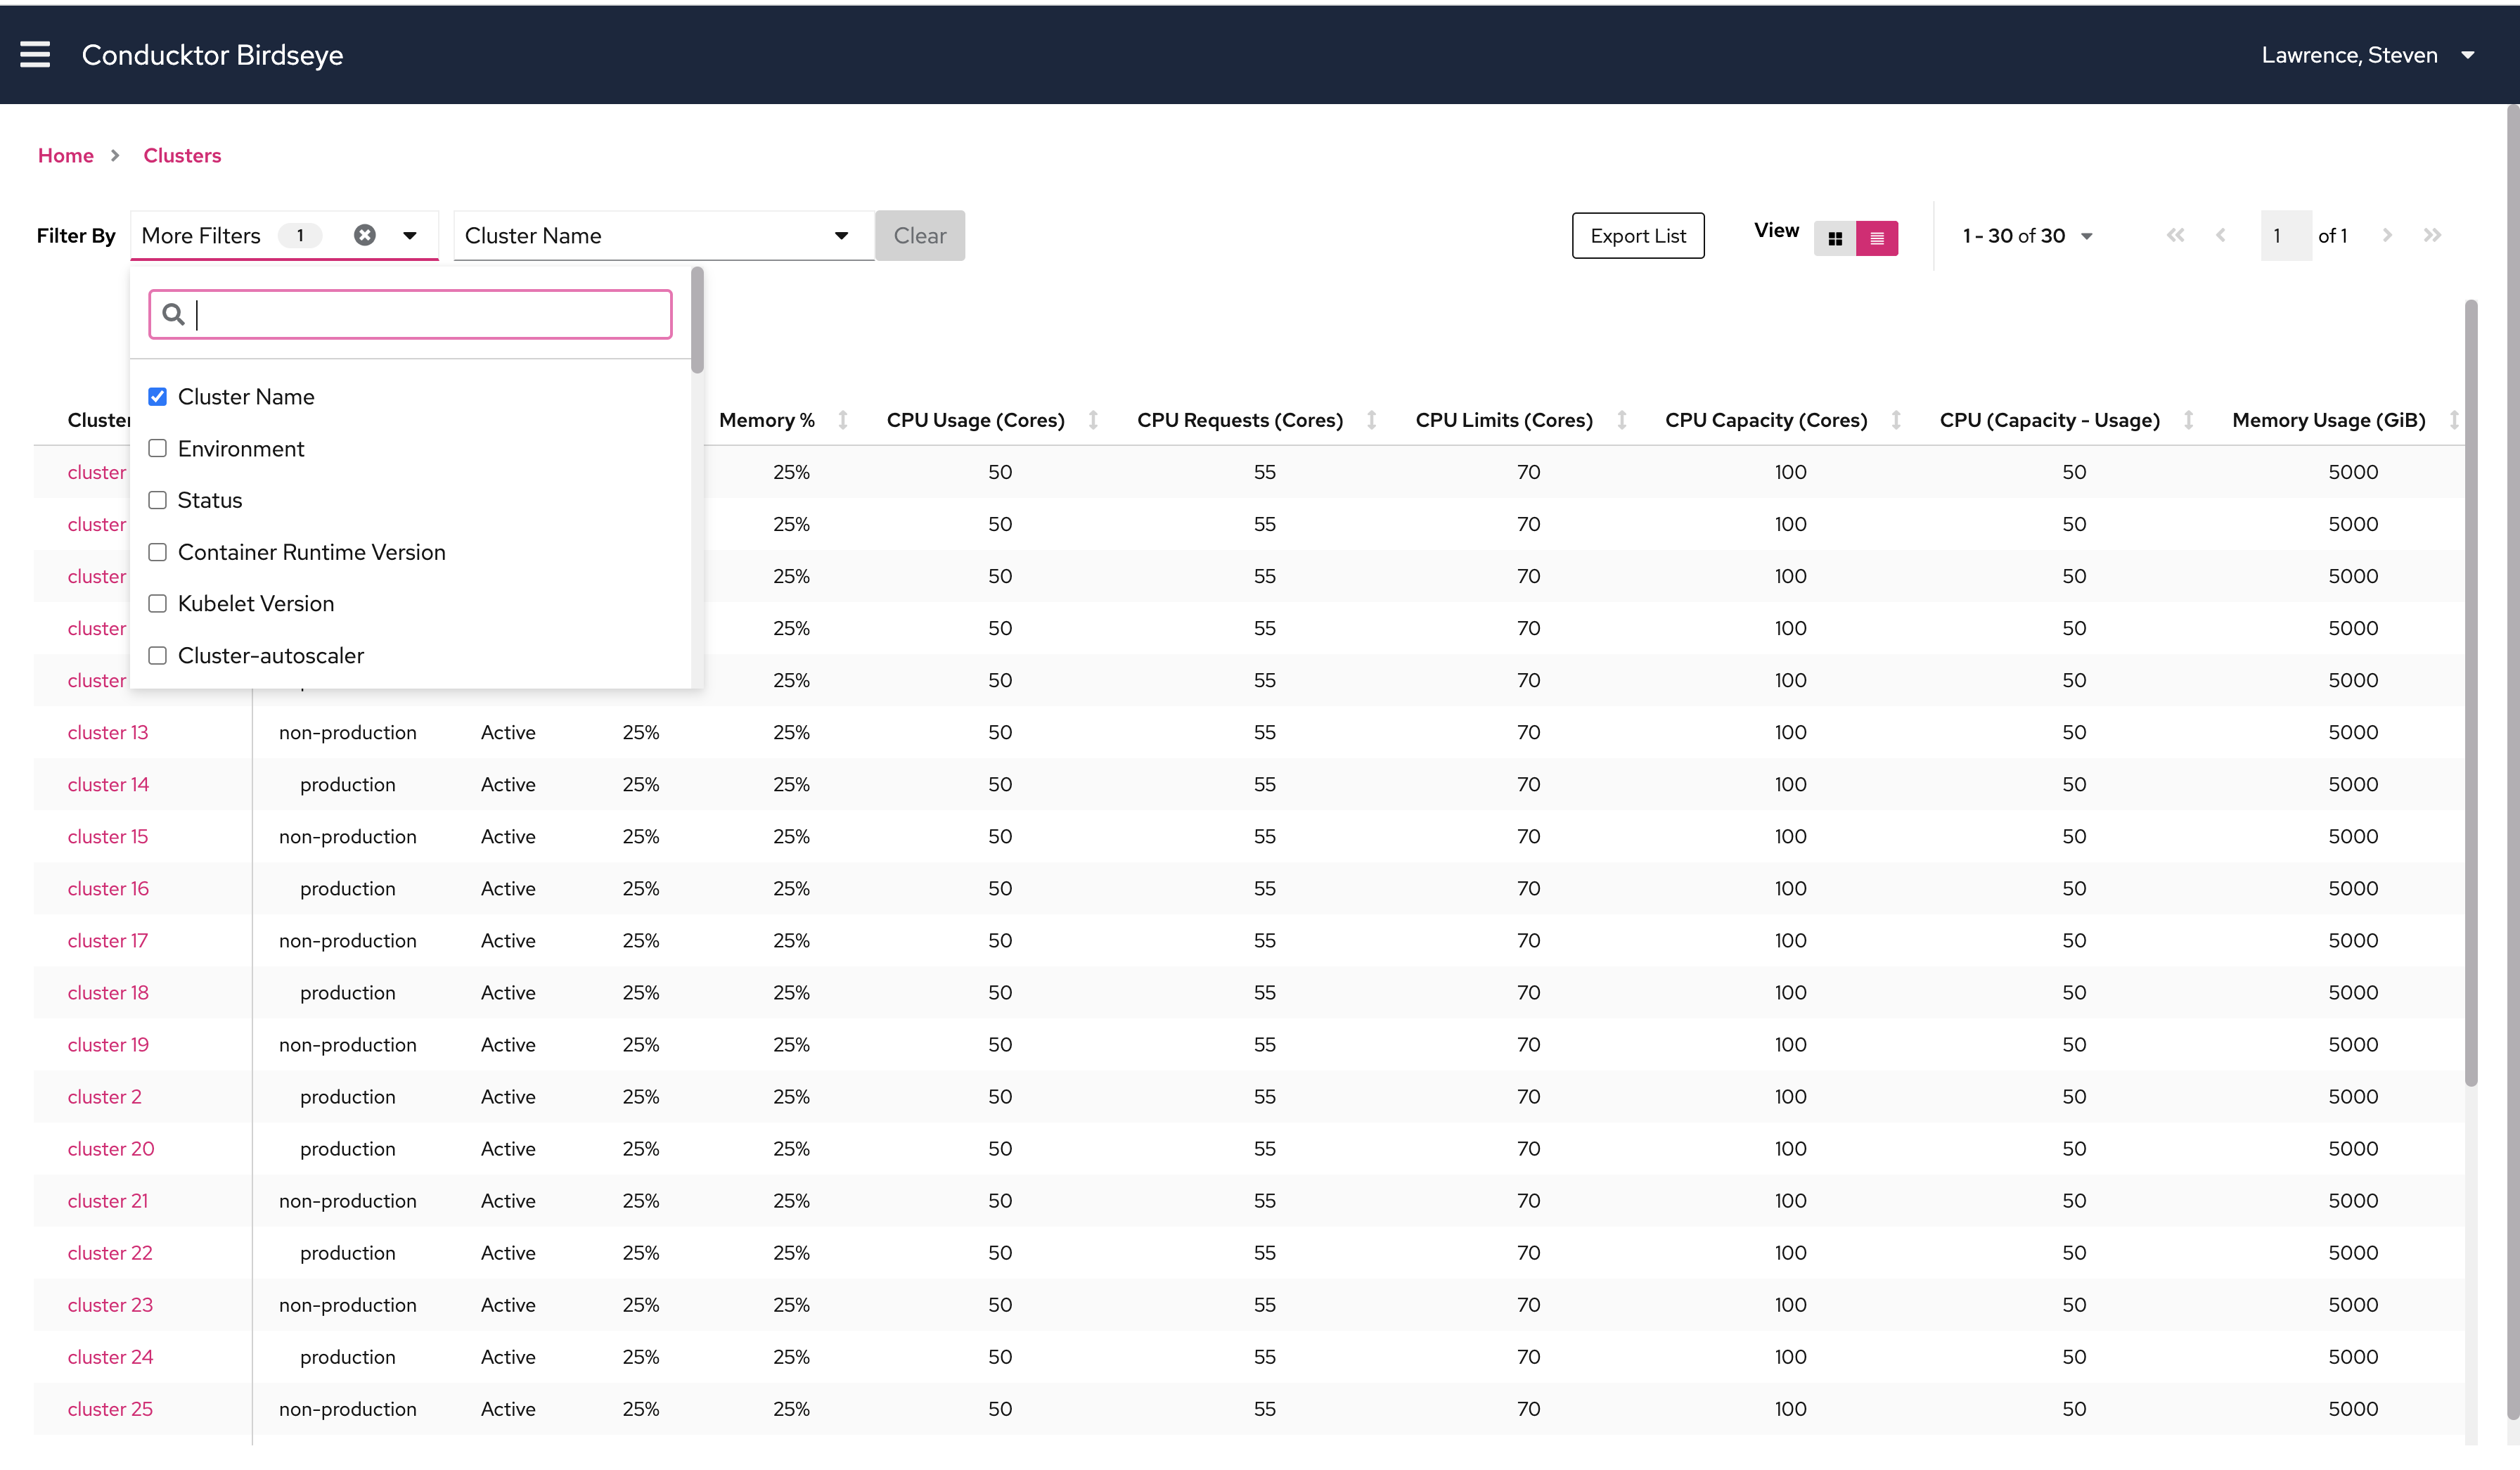
Users can select more categories to filter by.
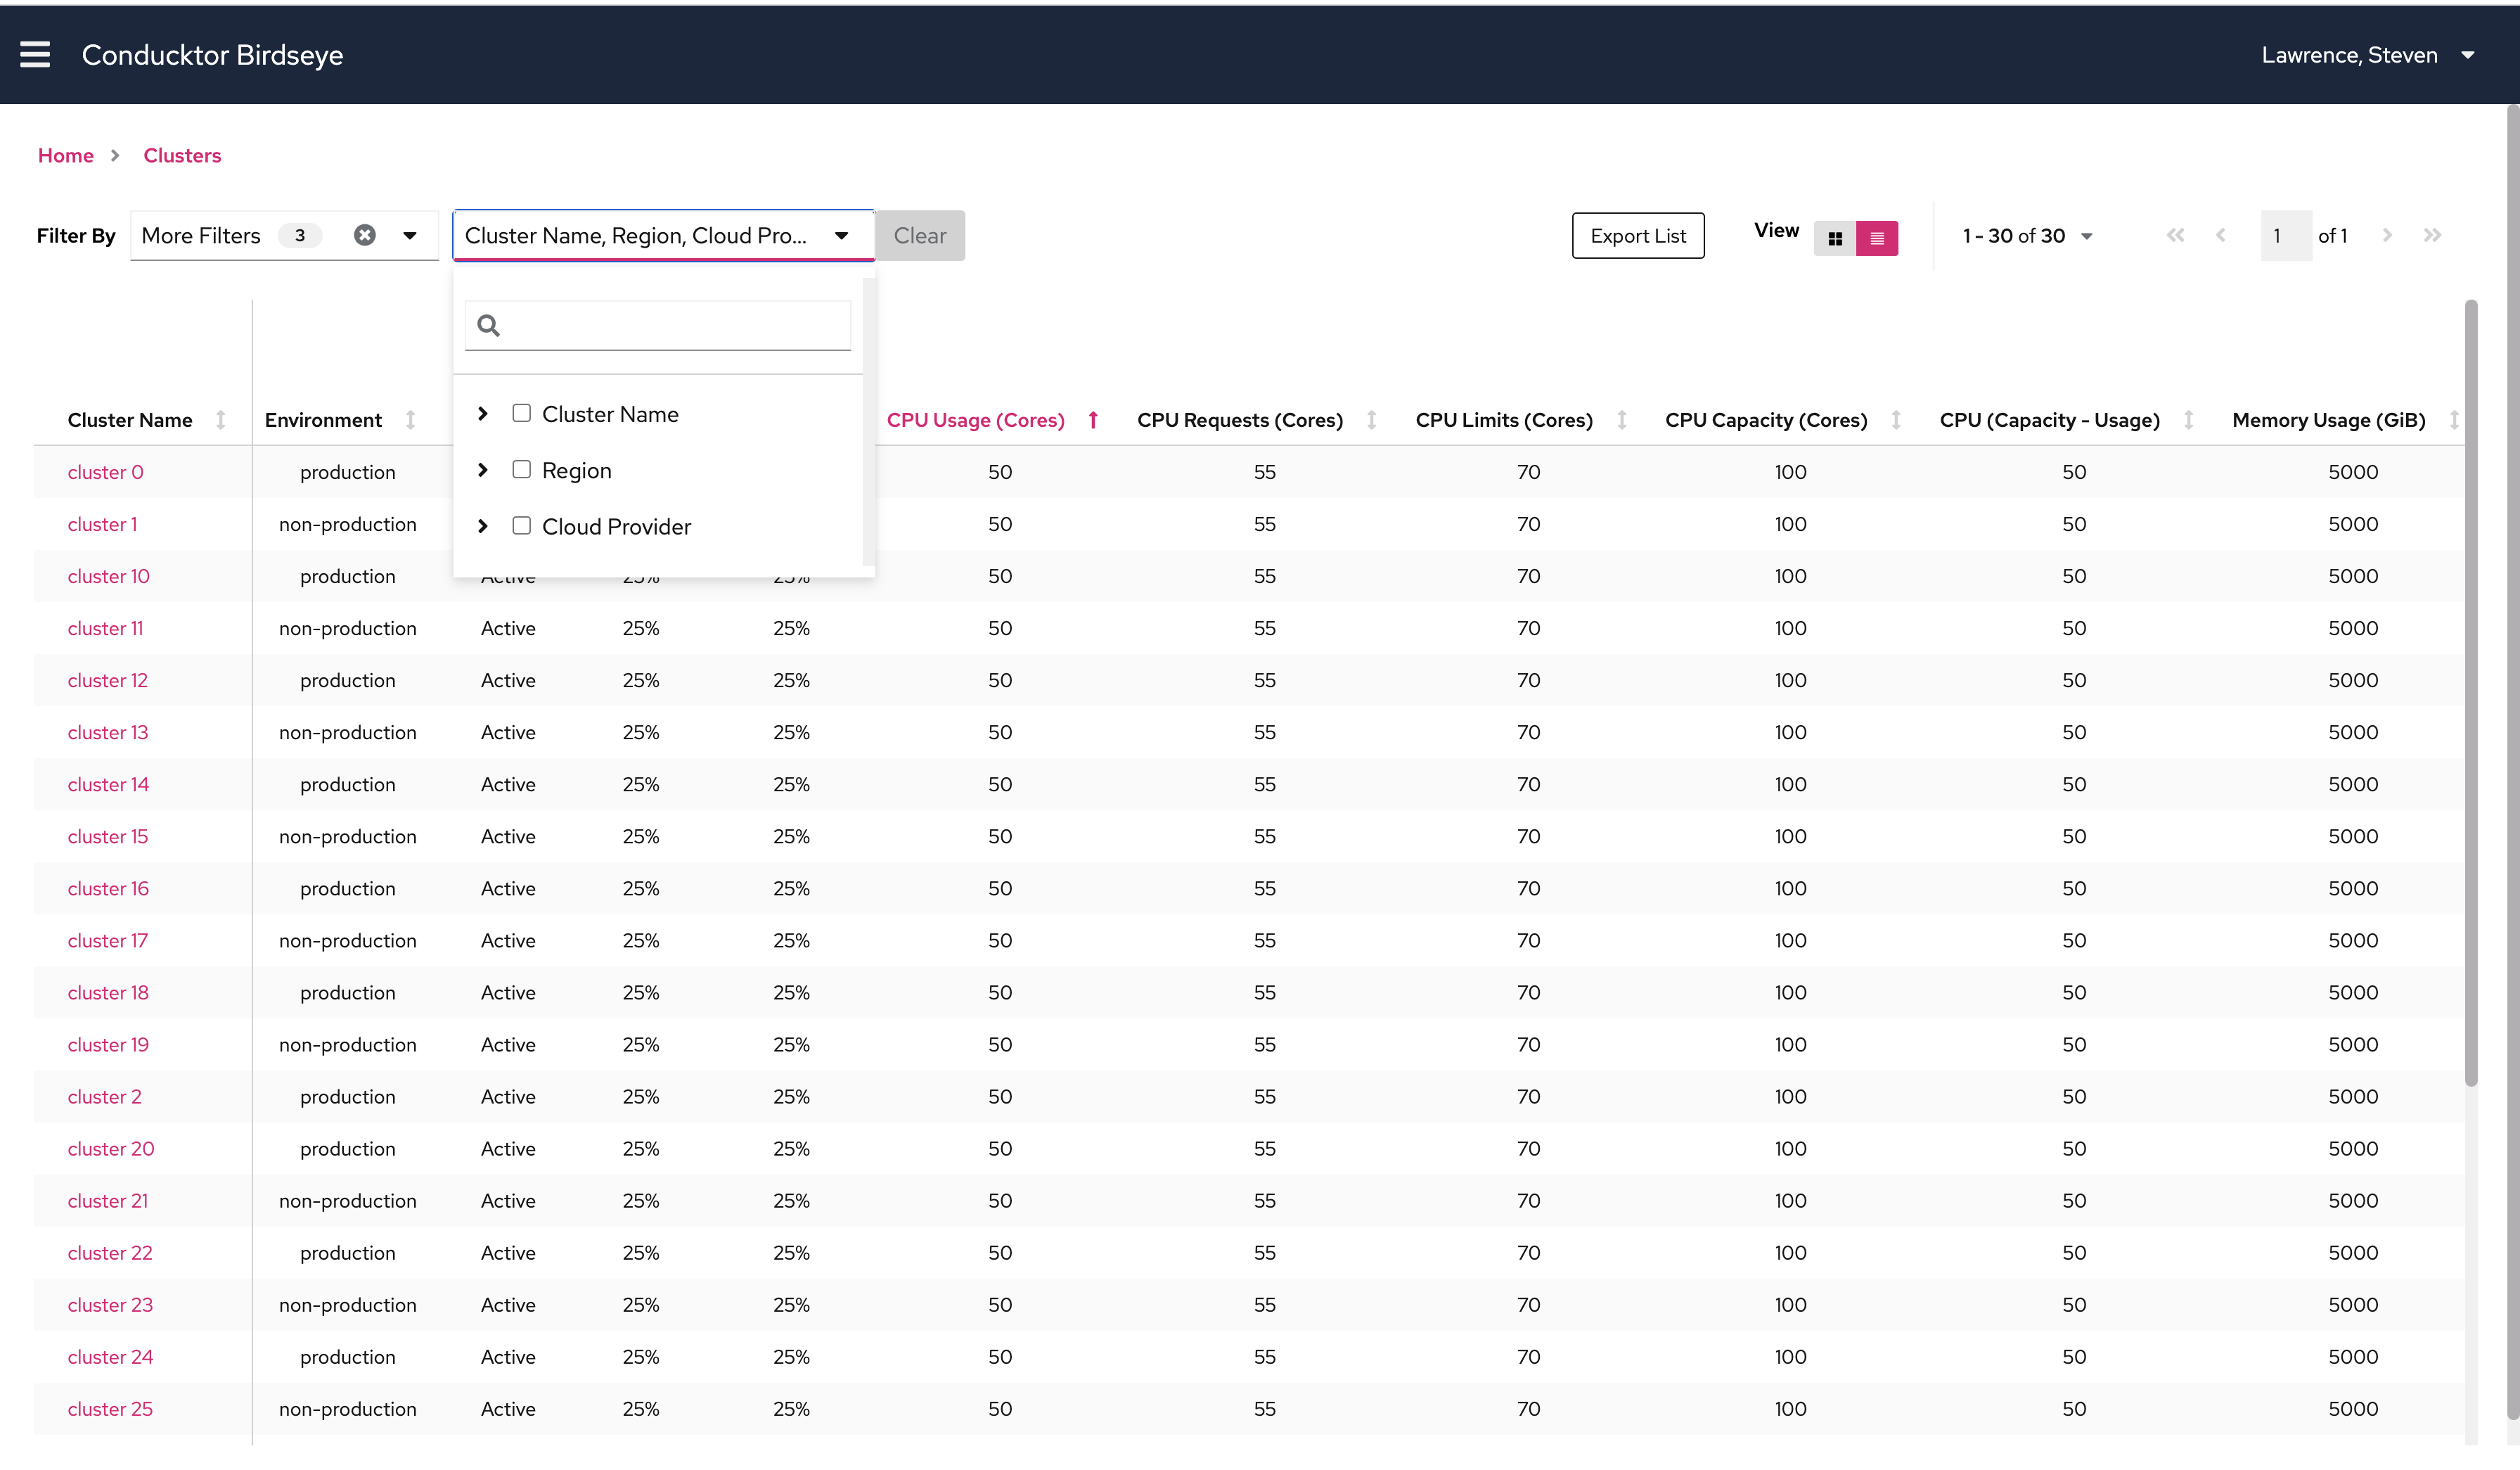
Filters are expandable when users open the dropdown.
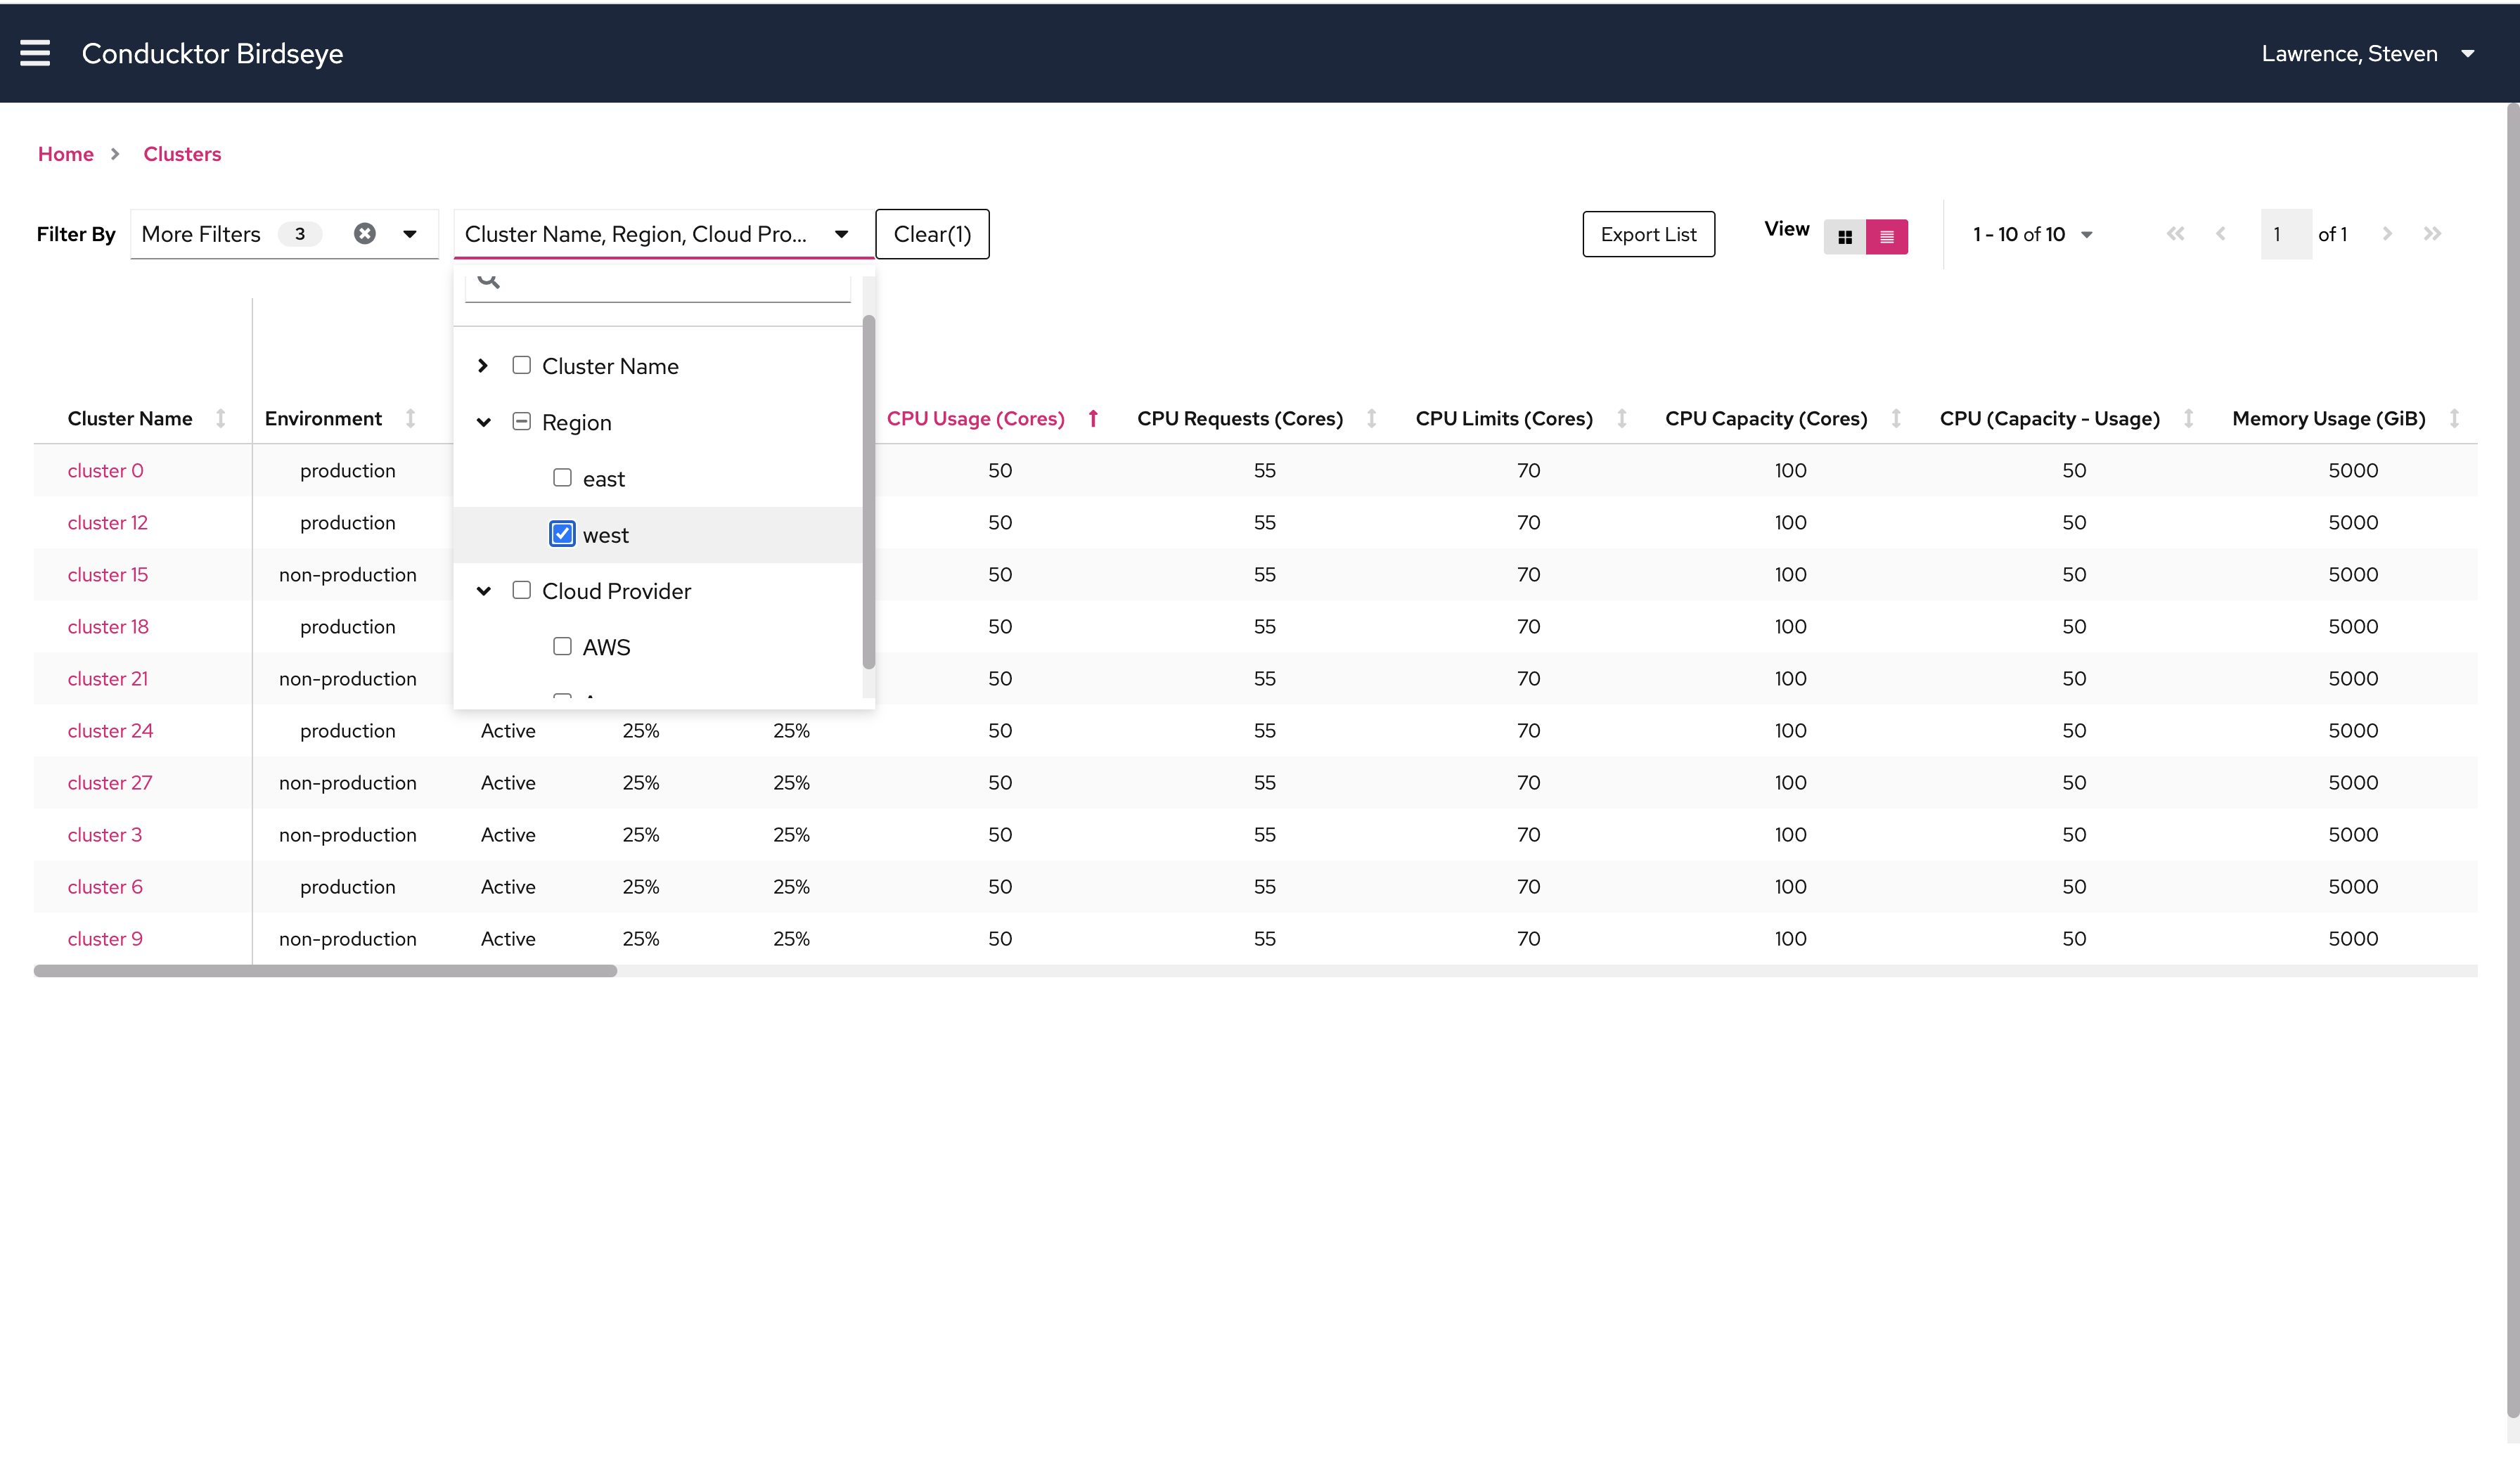
When users select a filter, the clusters in the view get narrowed down to satisfy the filters.
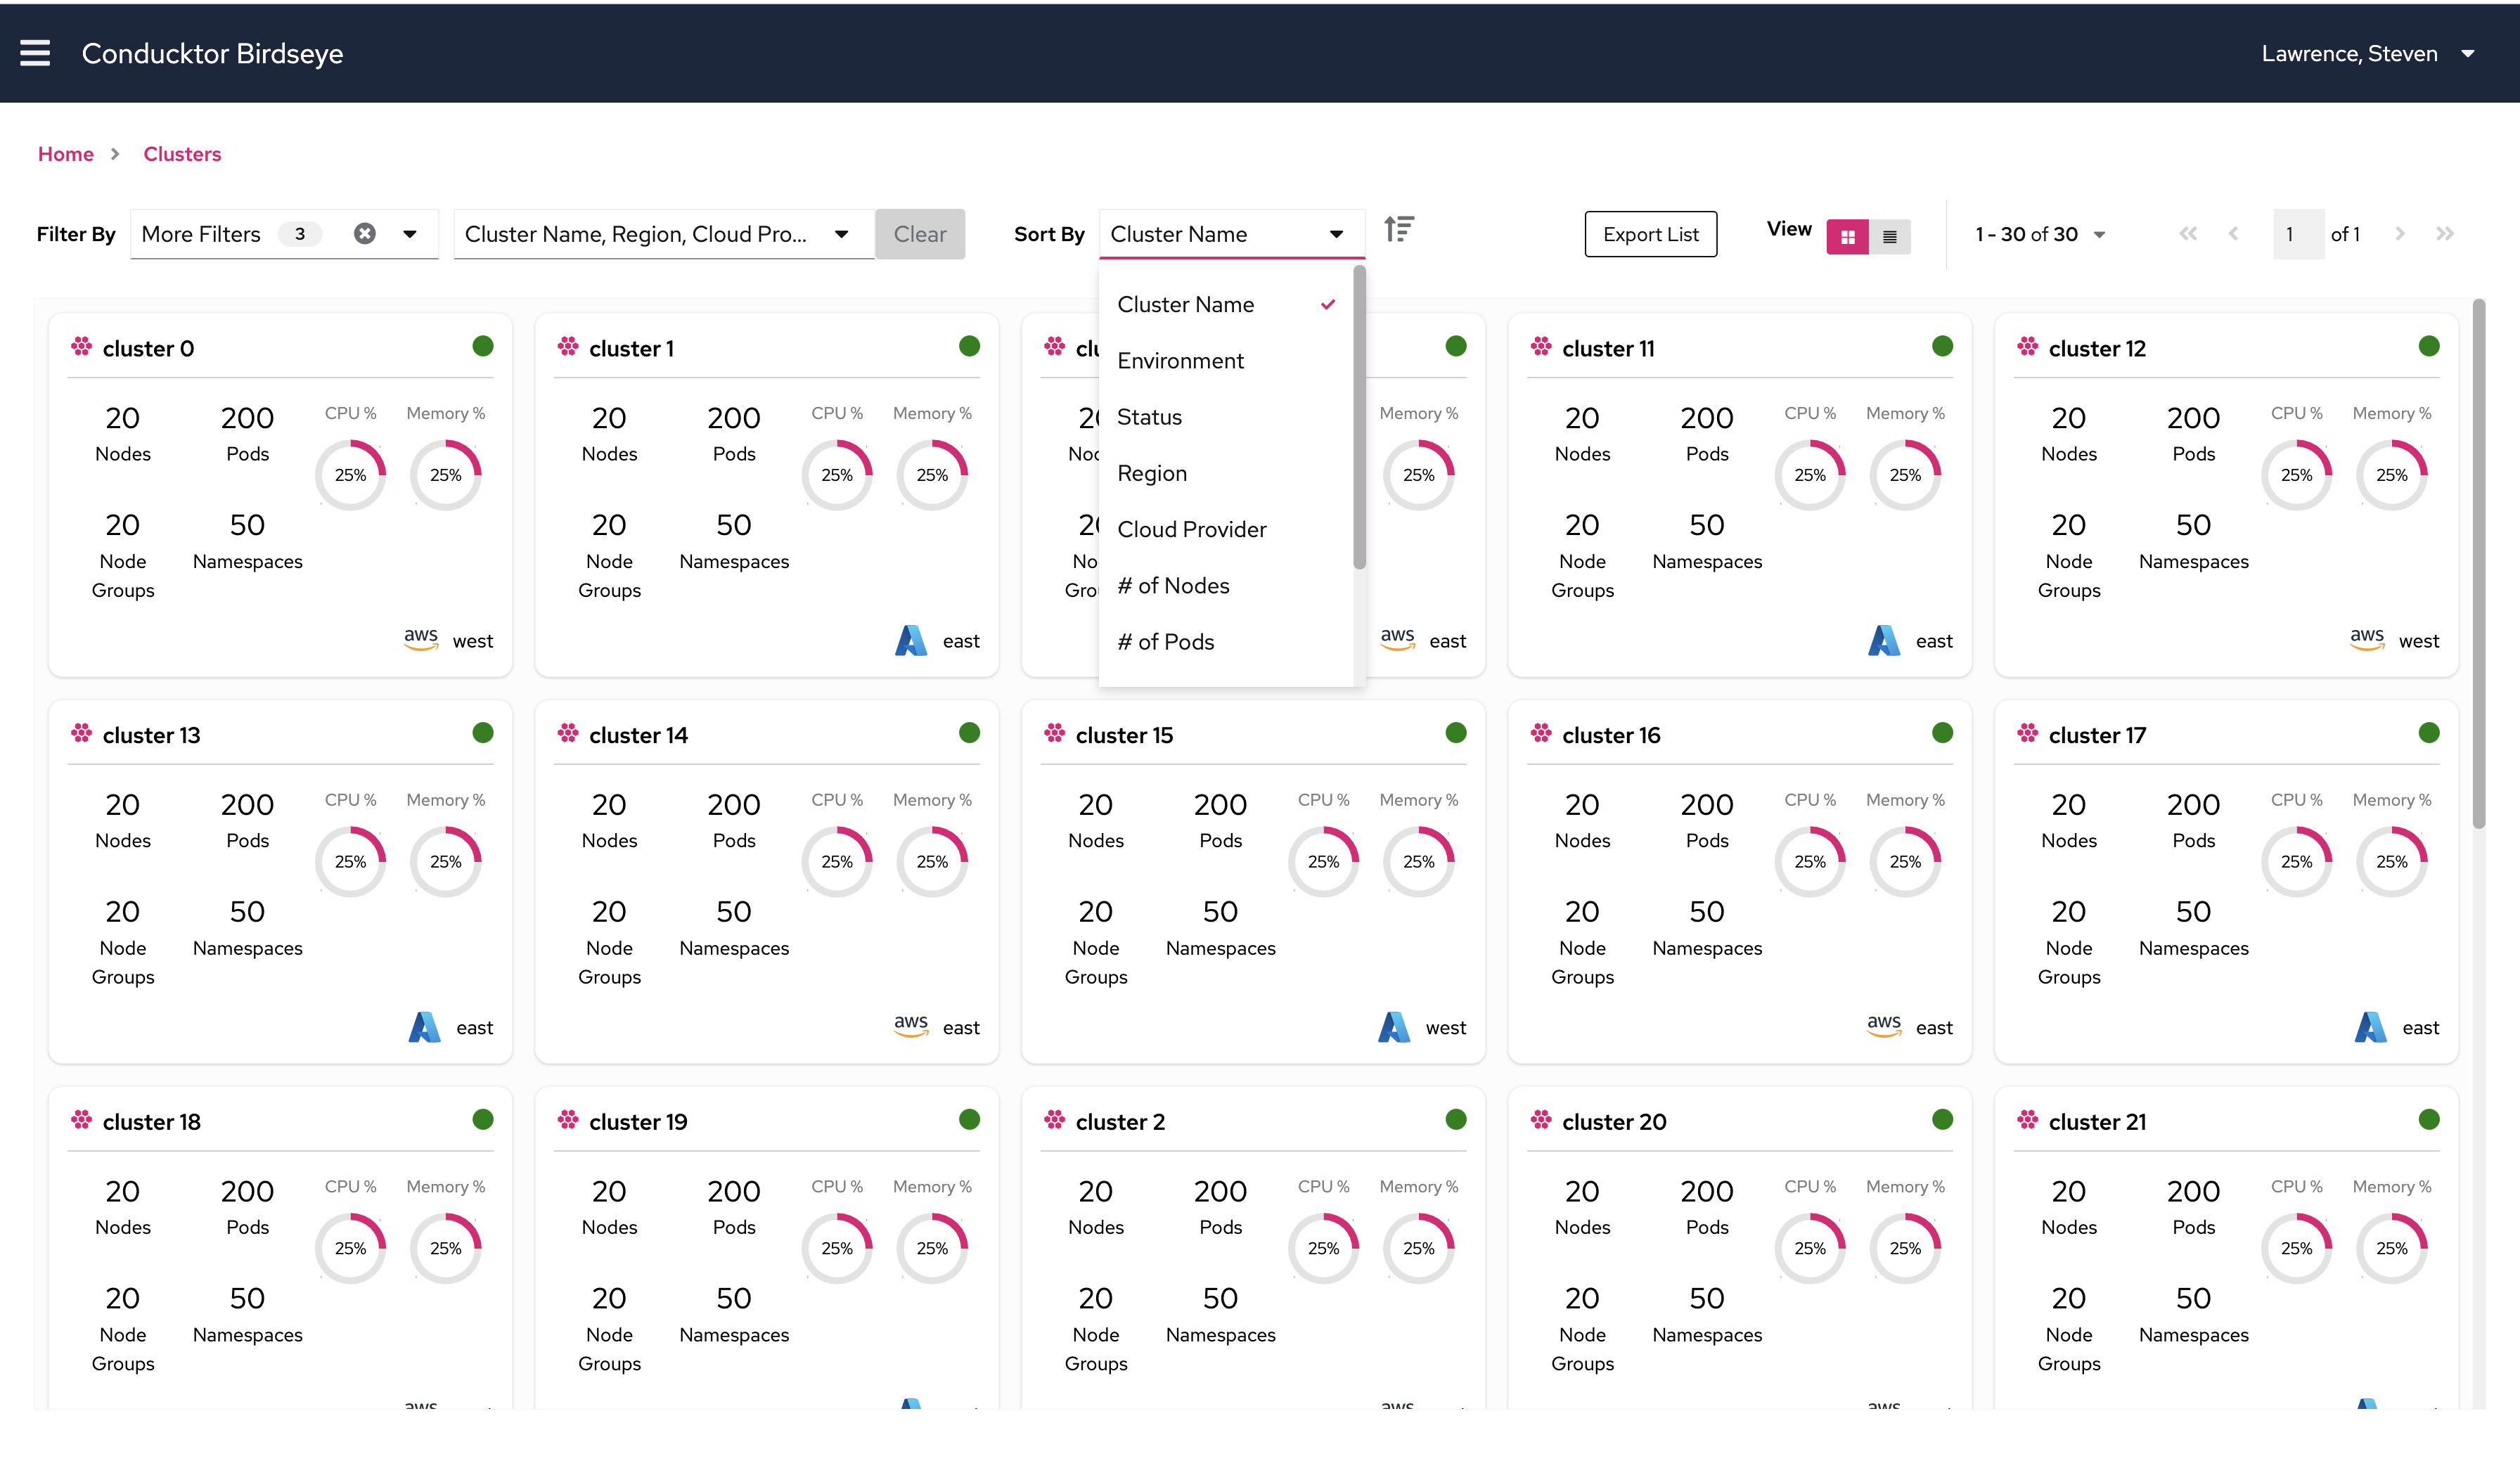
Users can also sort by different categories in the tile view.
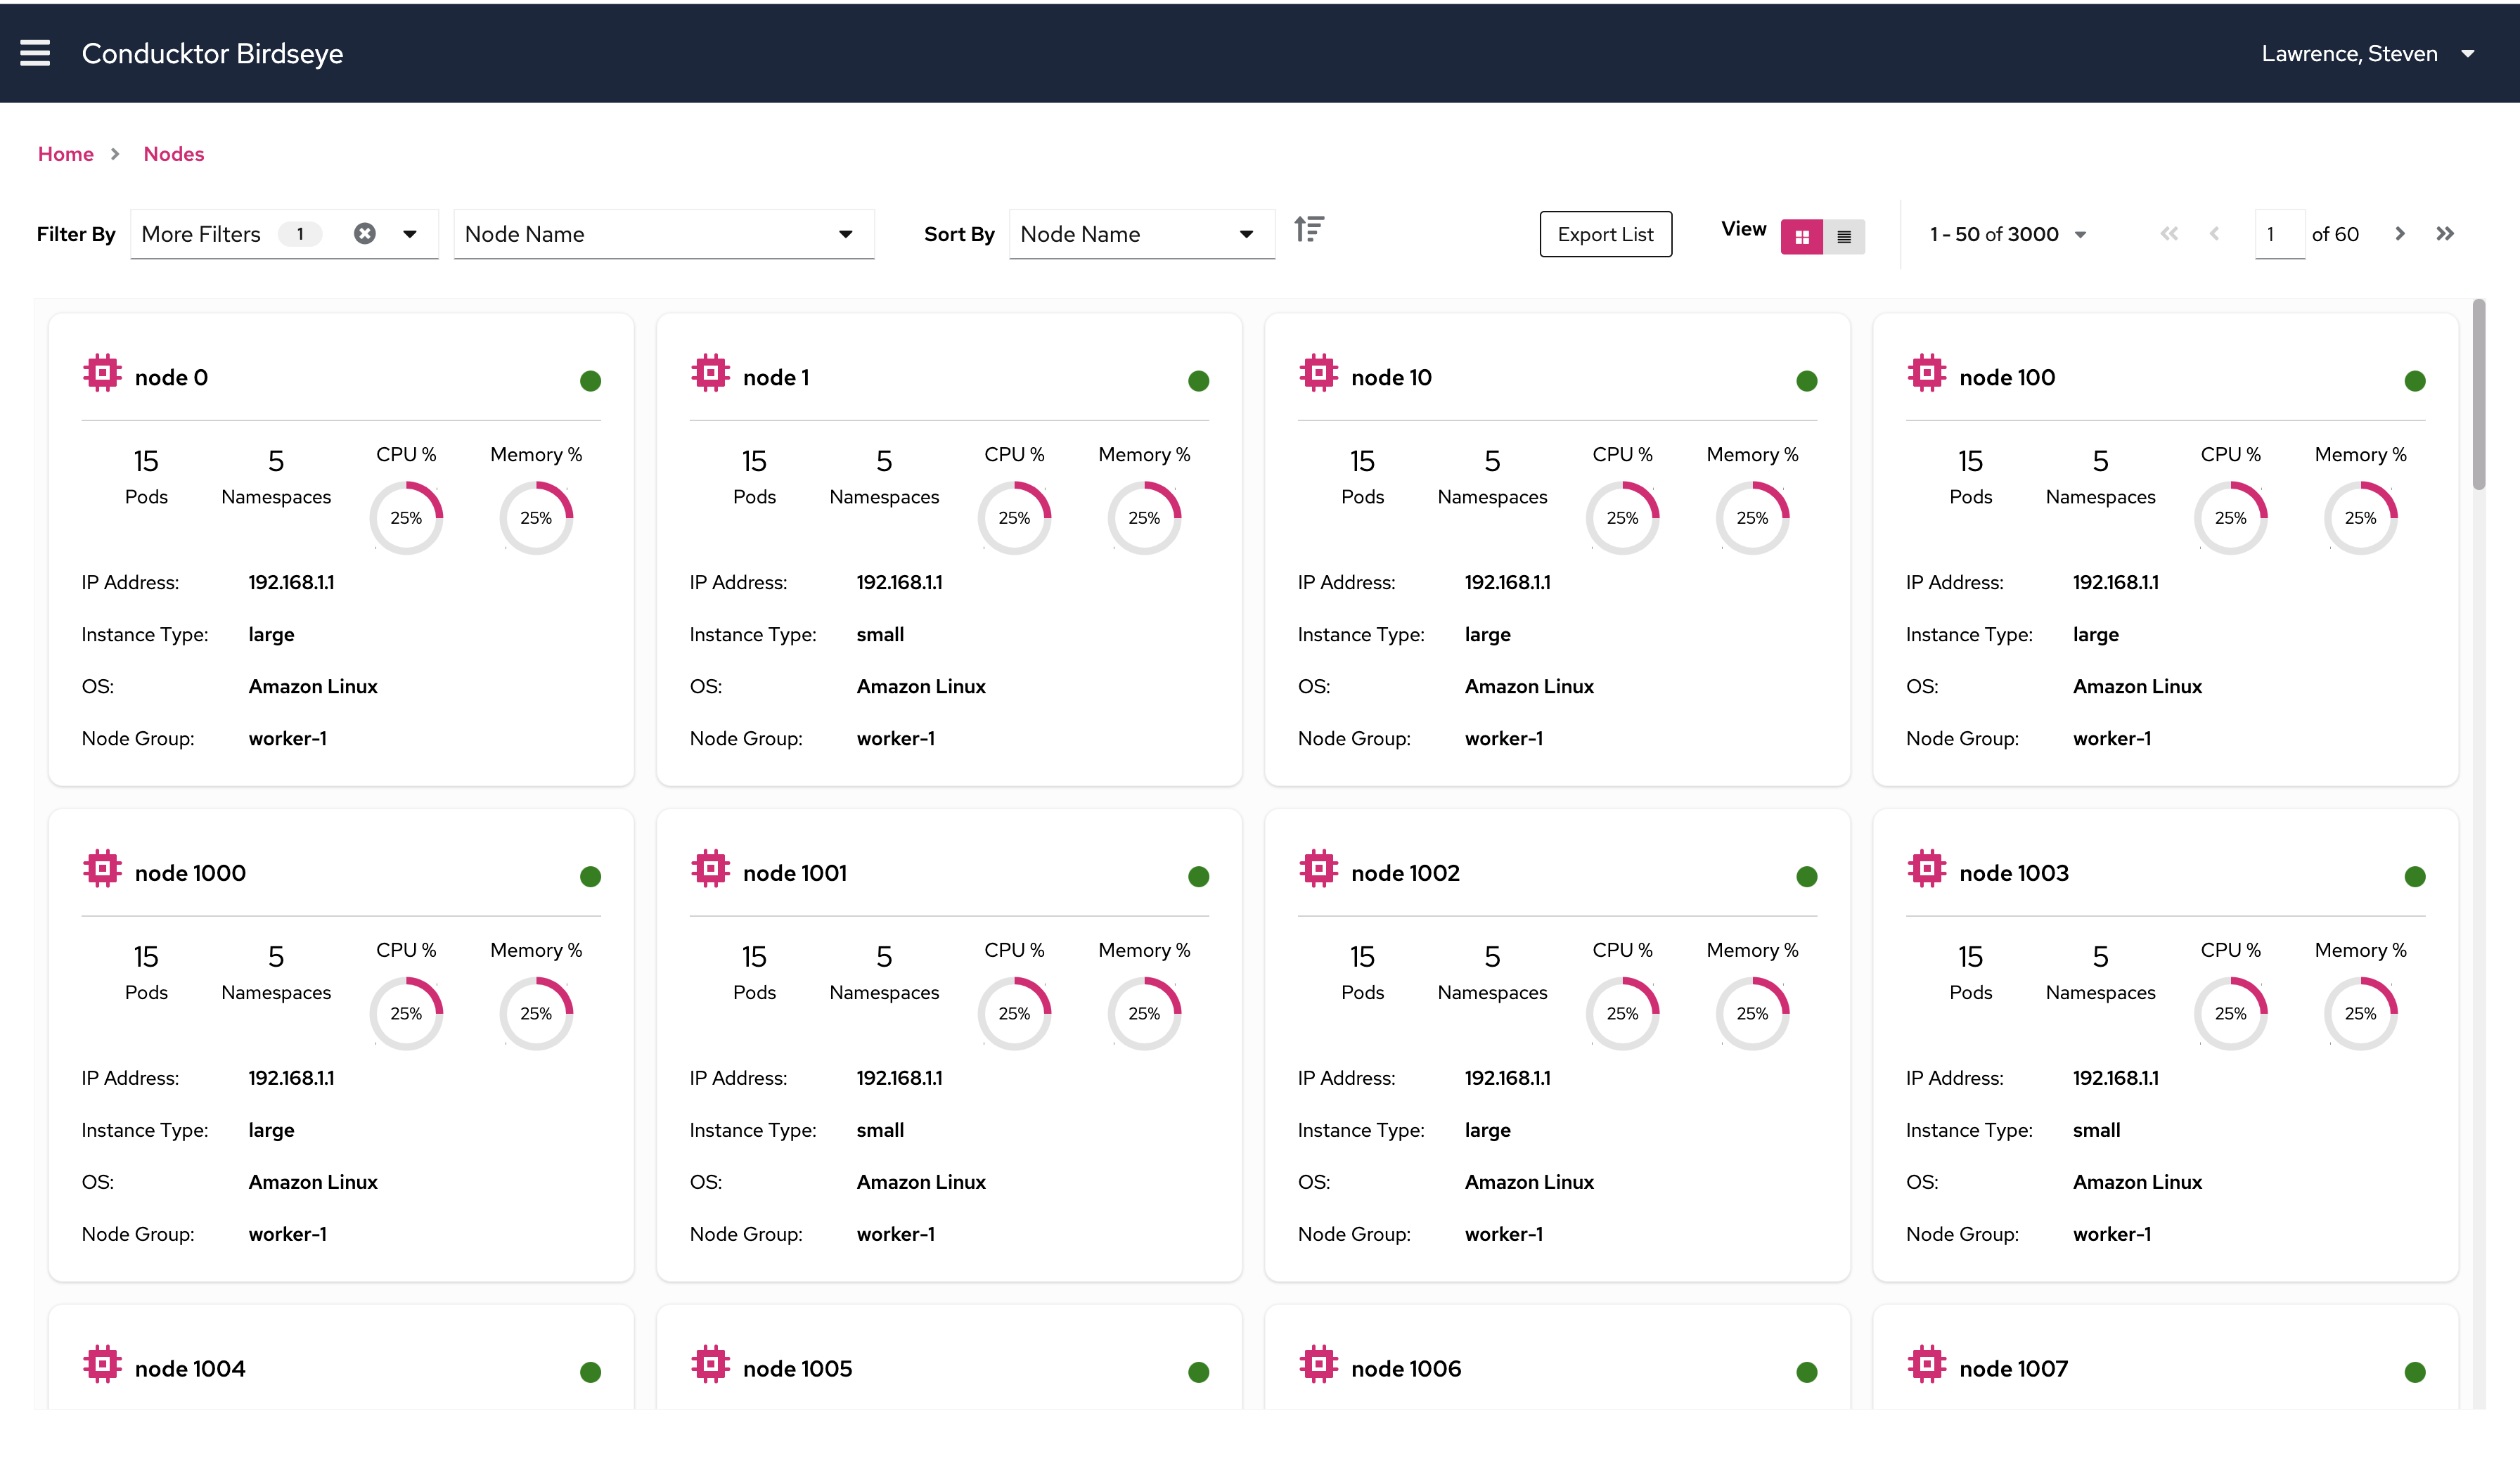
Node tile view which represents each node in a single tile.
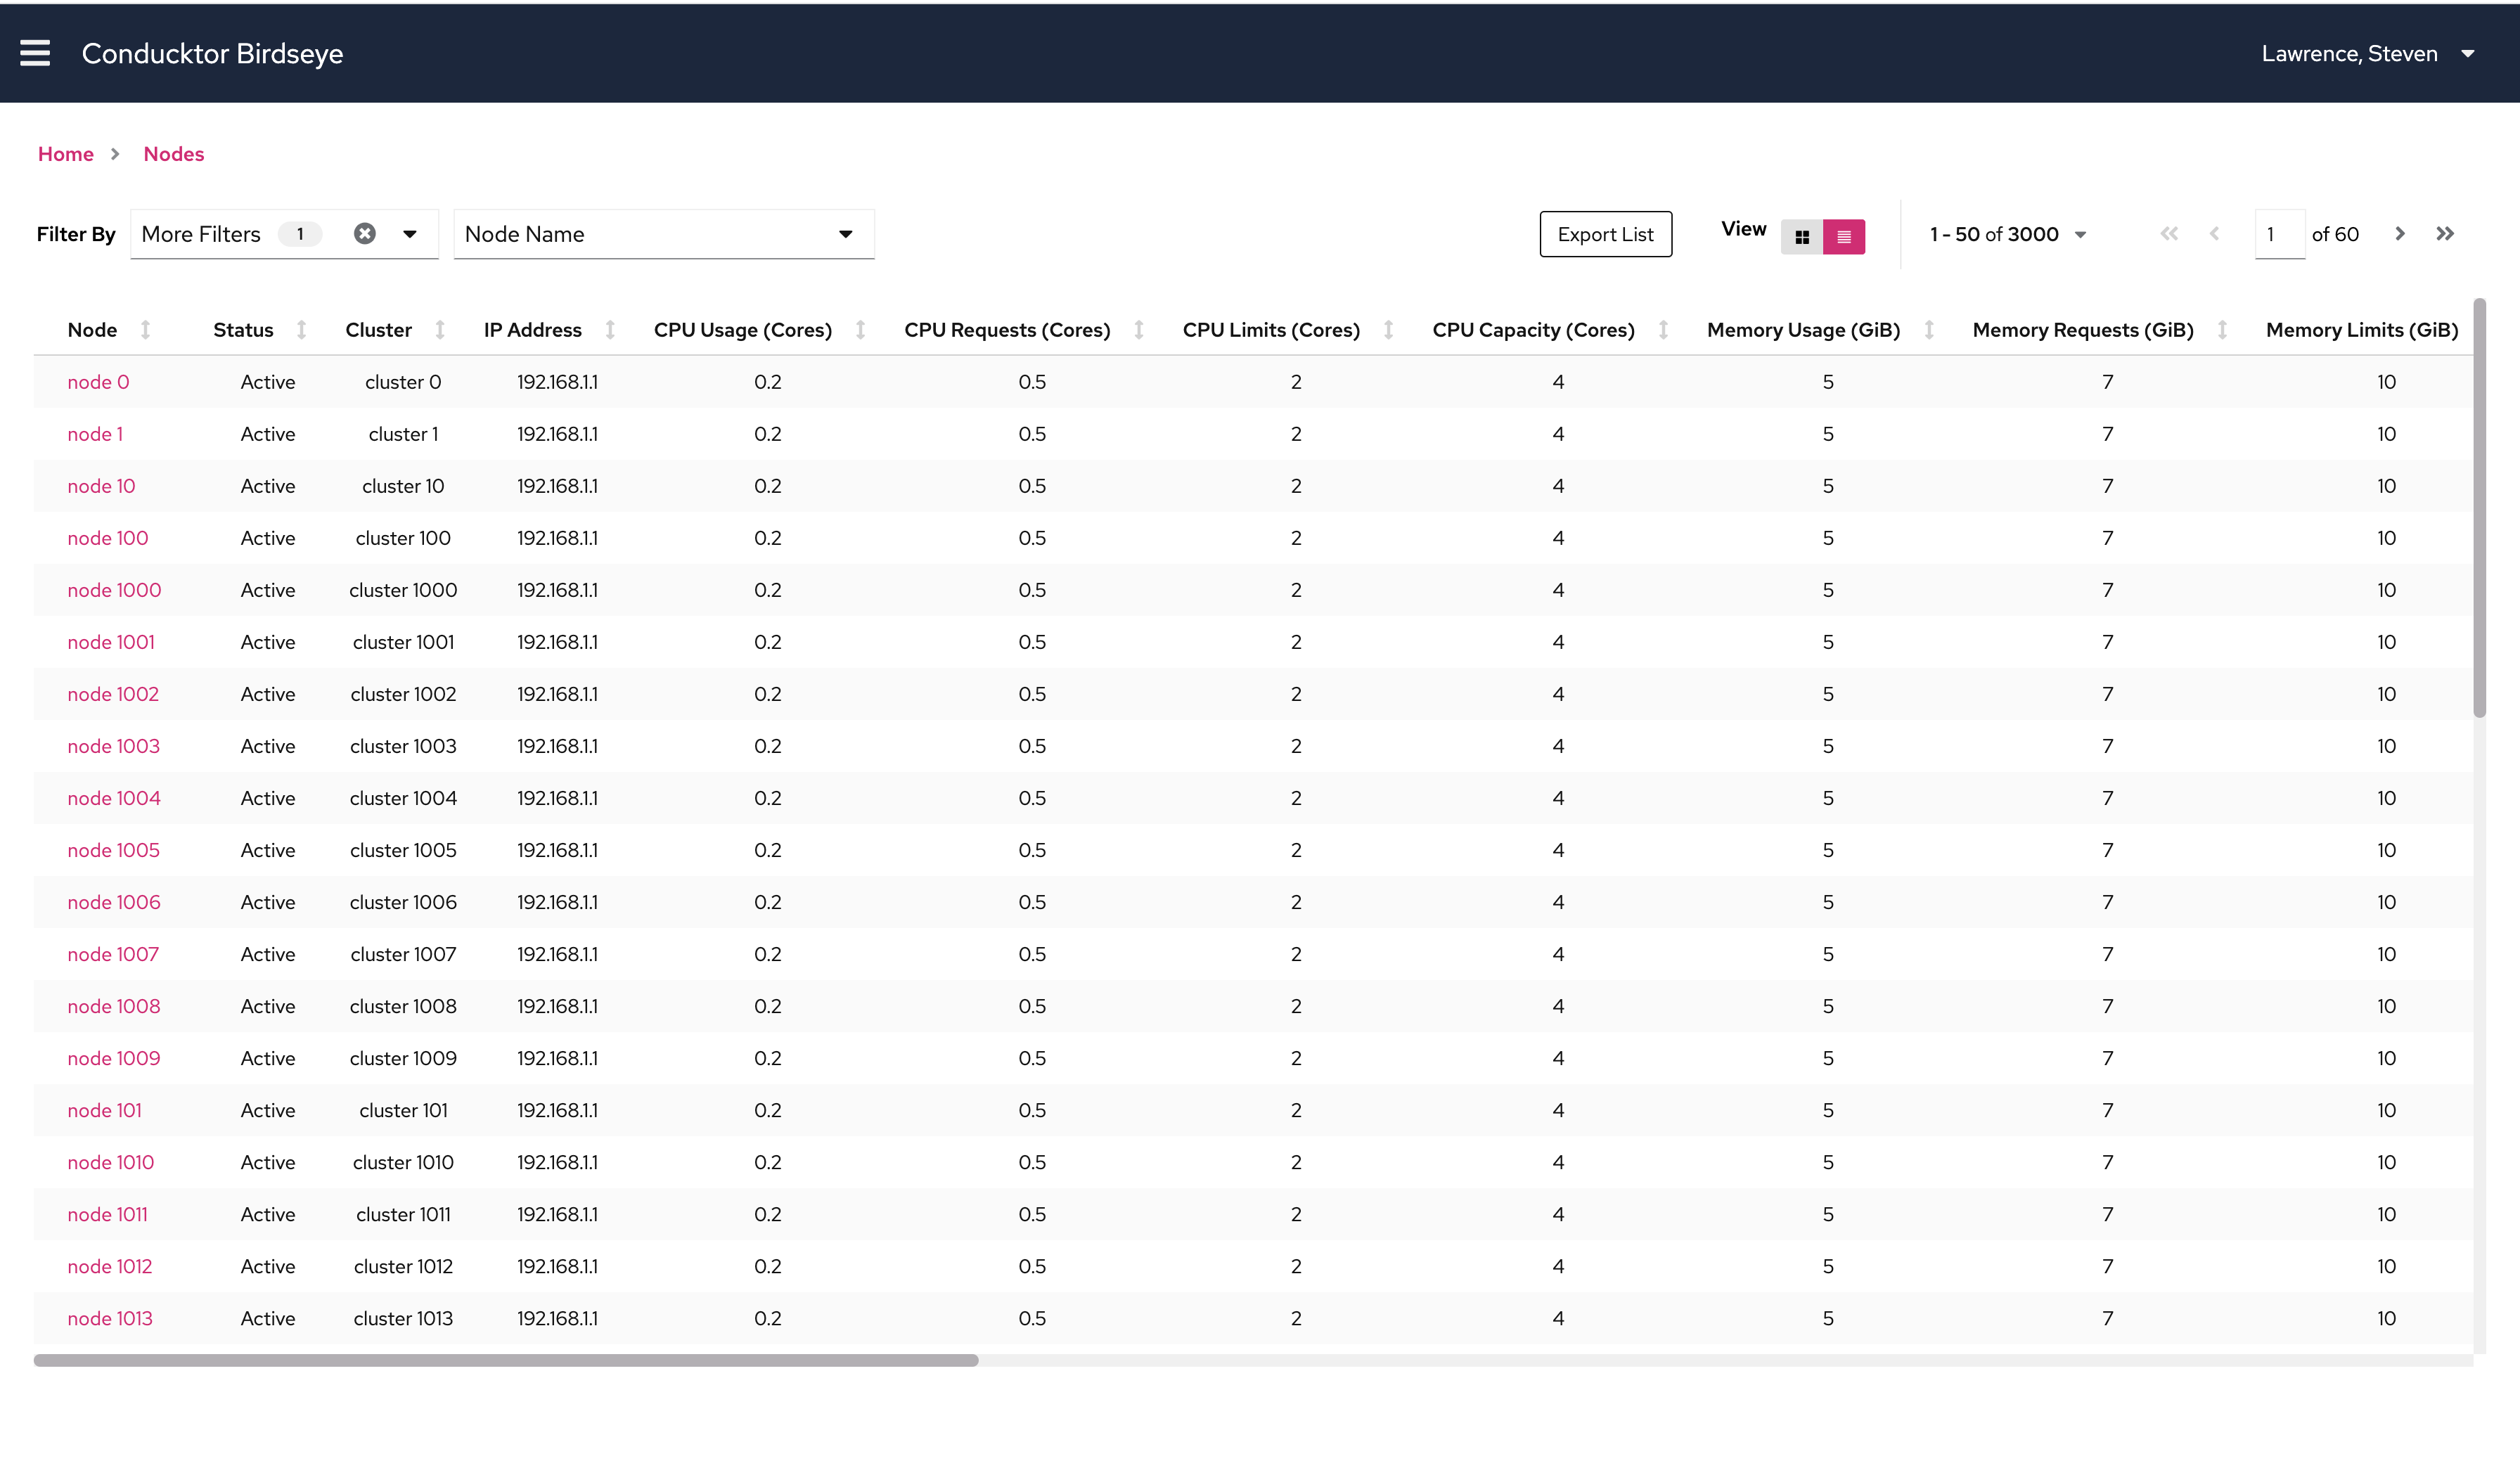
Node table view which shows metrics and data for all nodes in a single table.
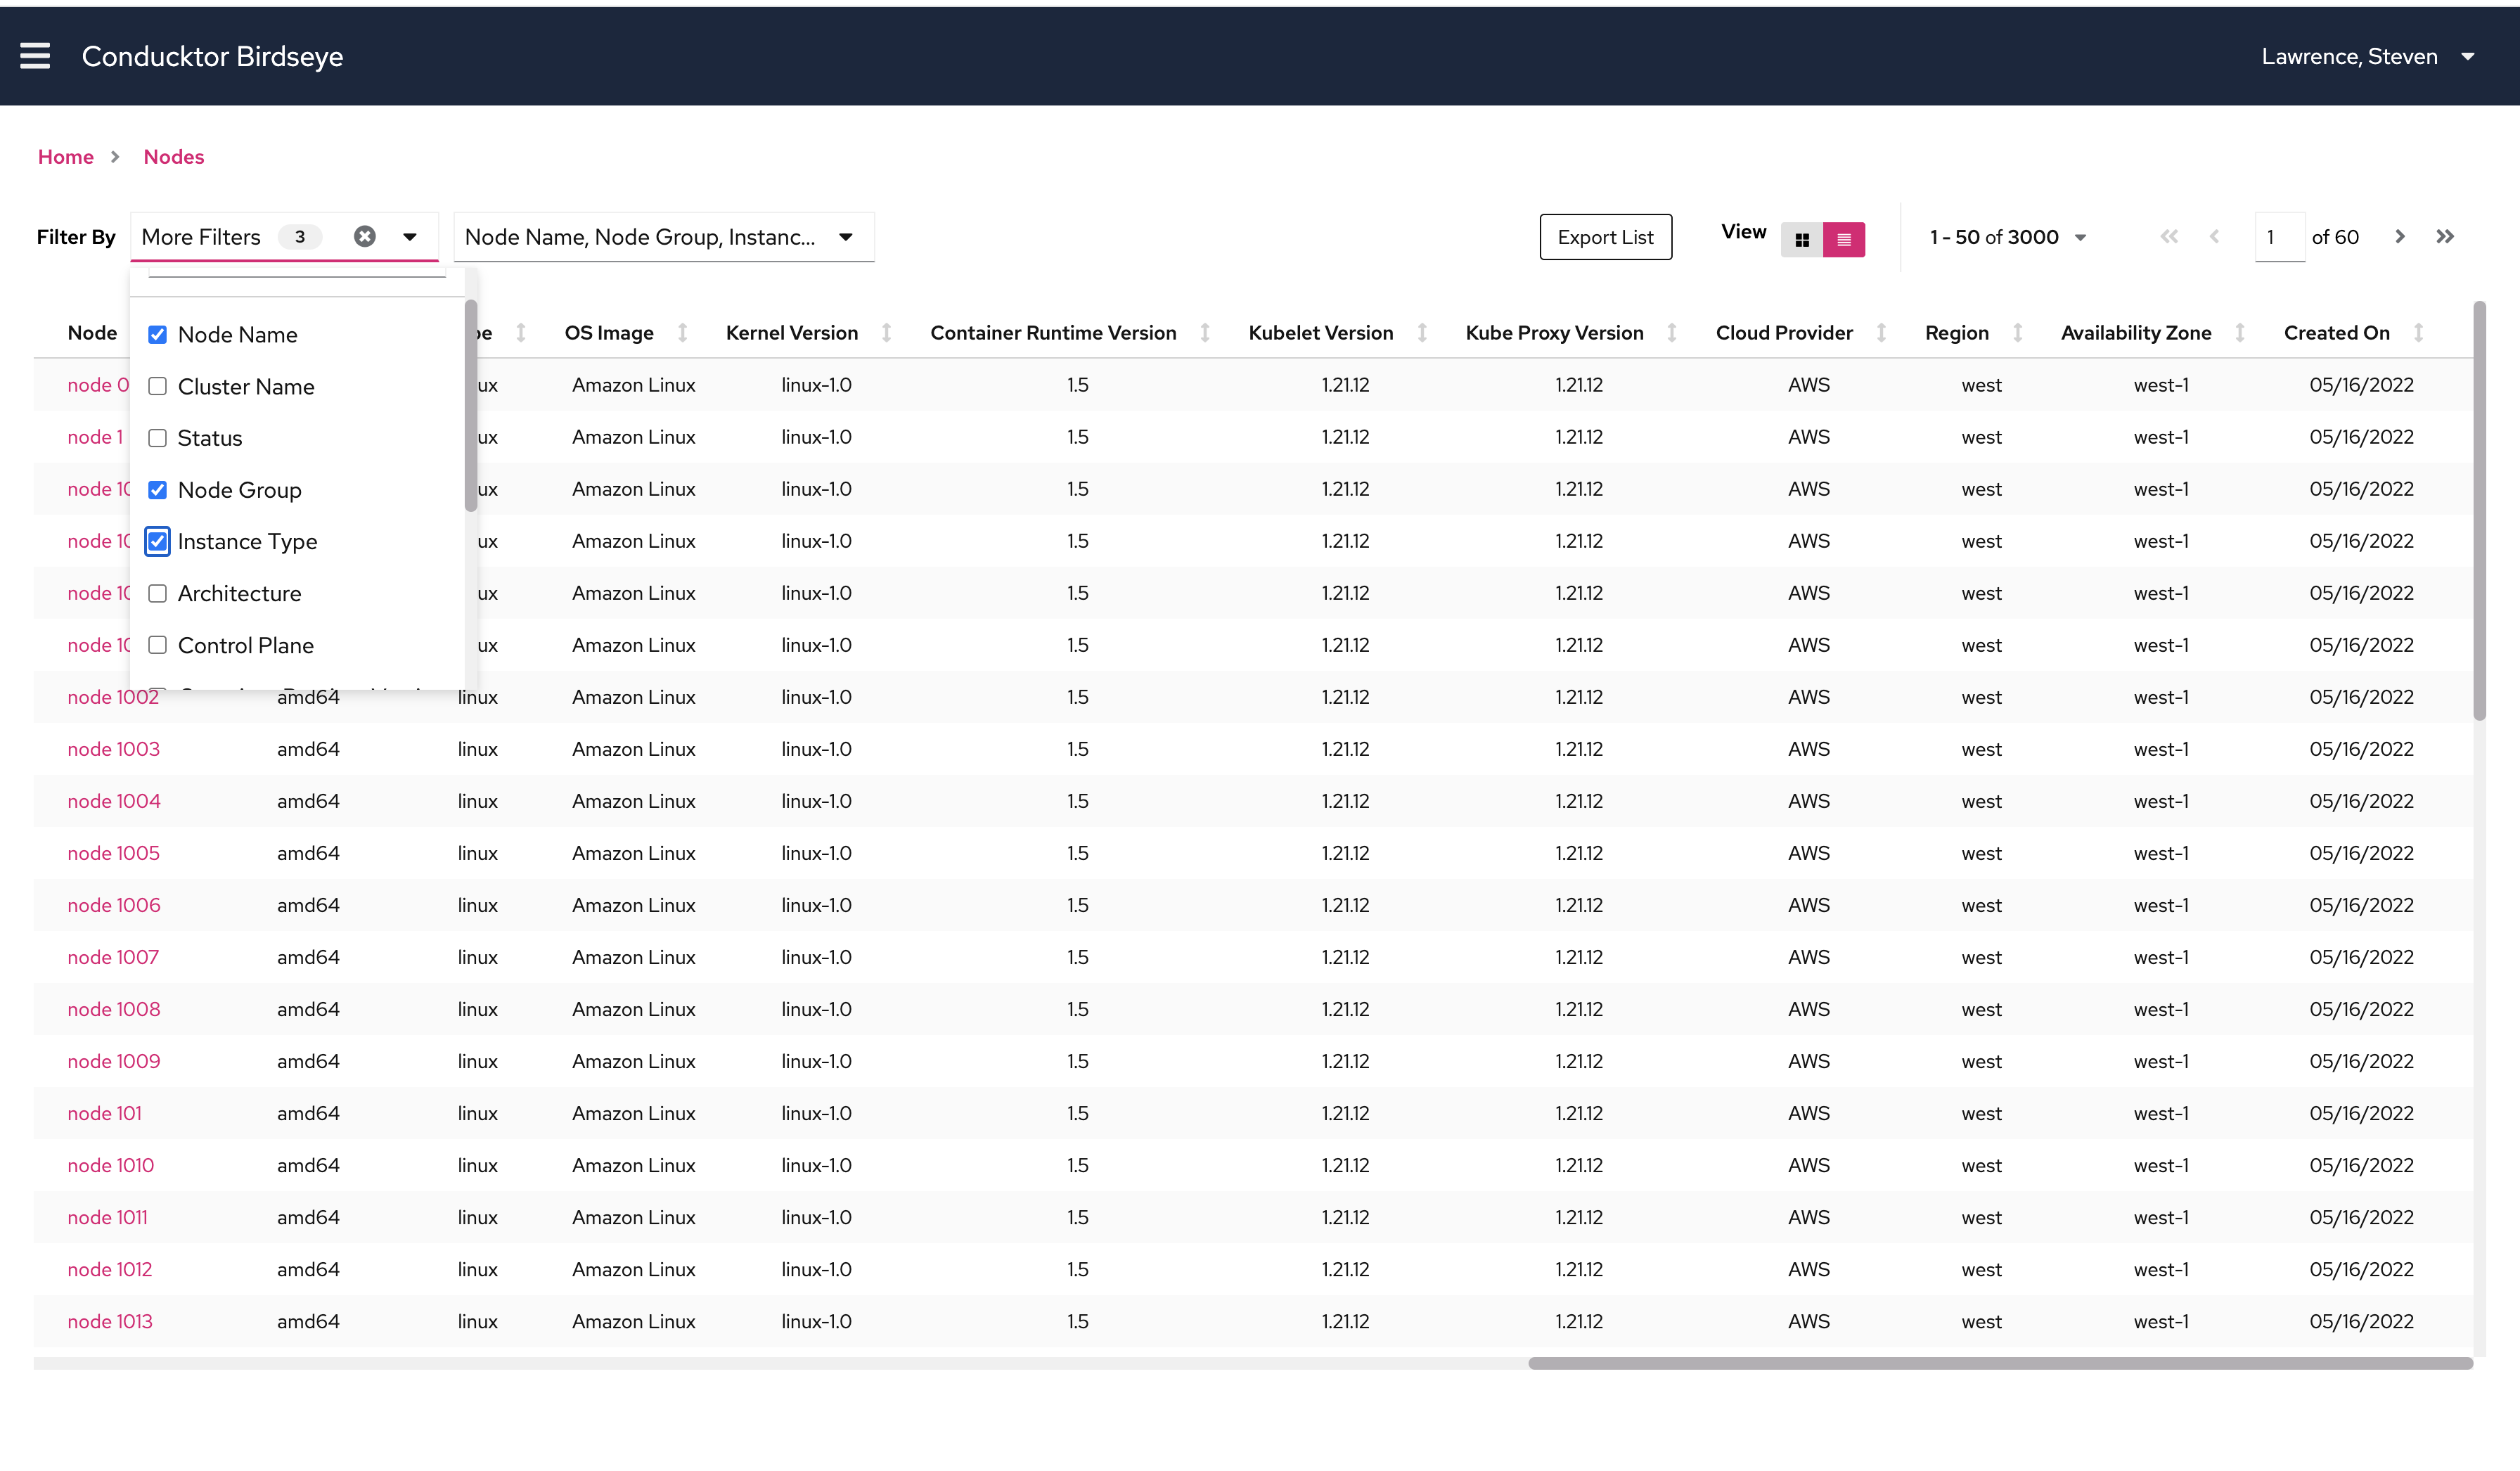
Users can select more categories to filter nodes by.
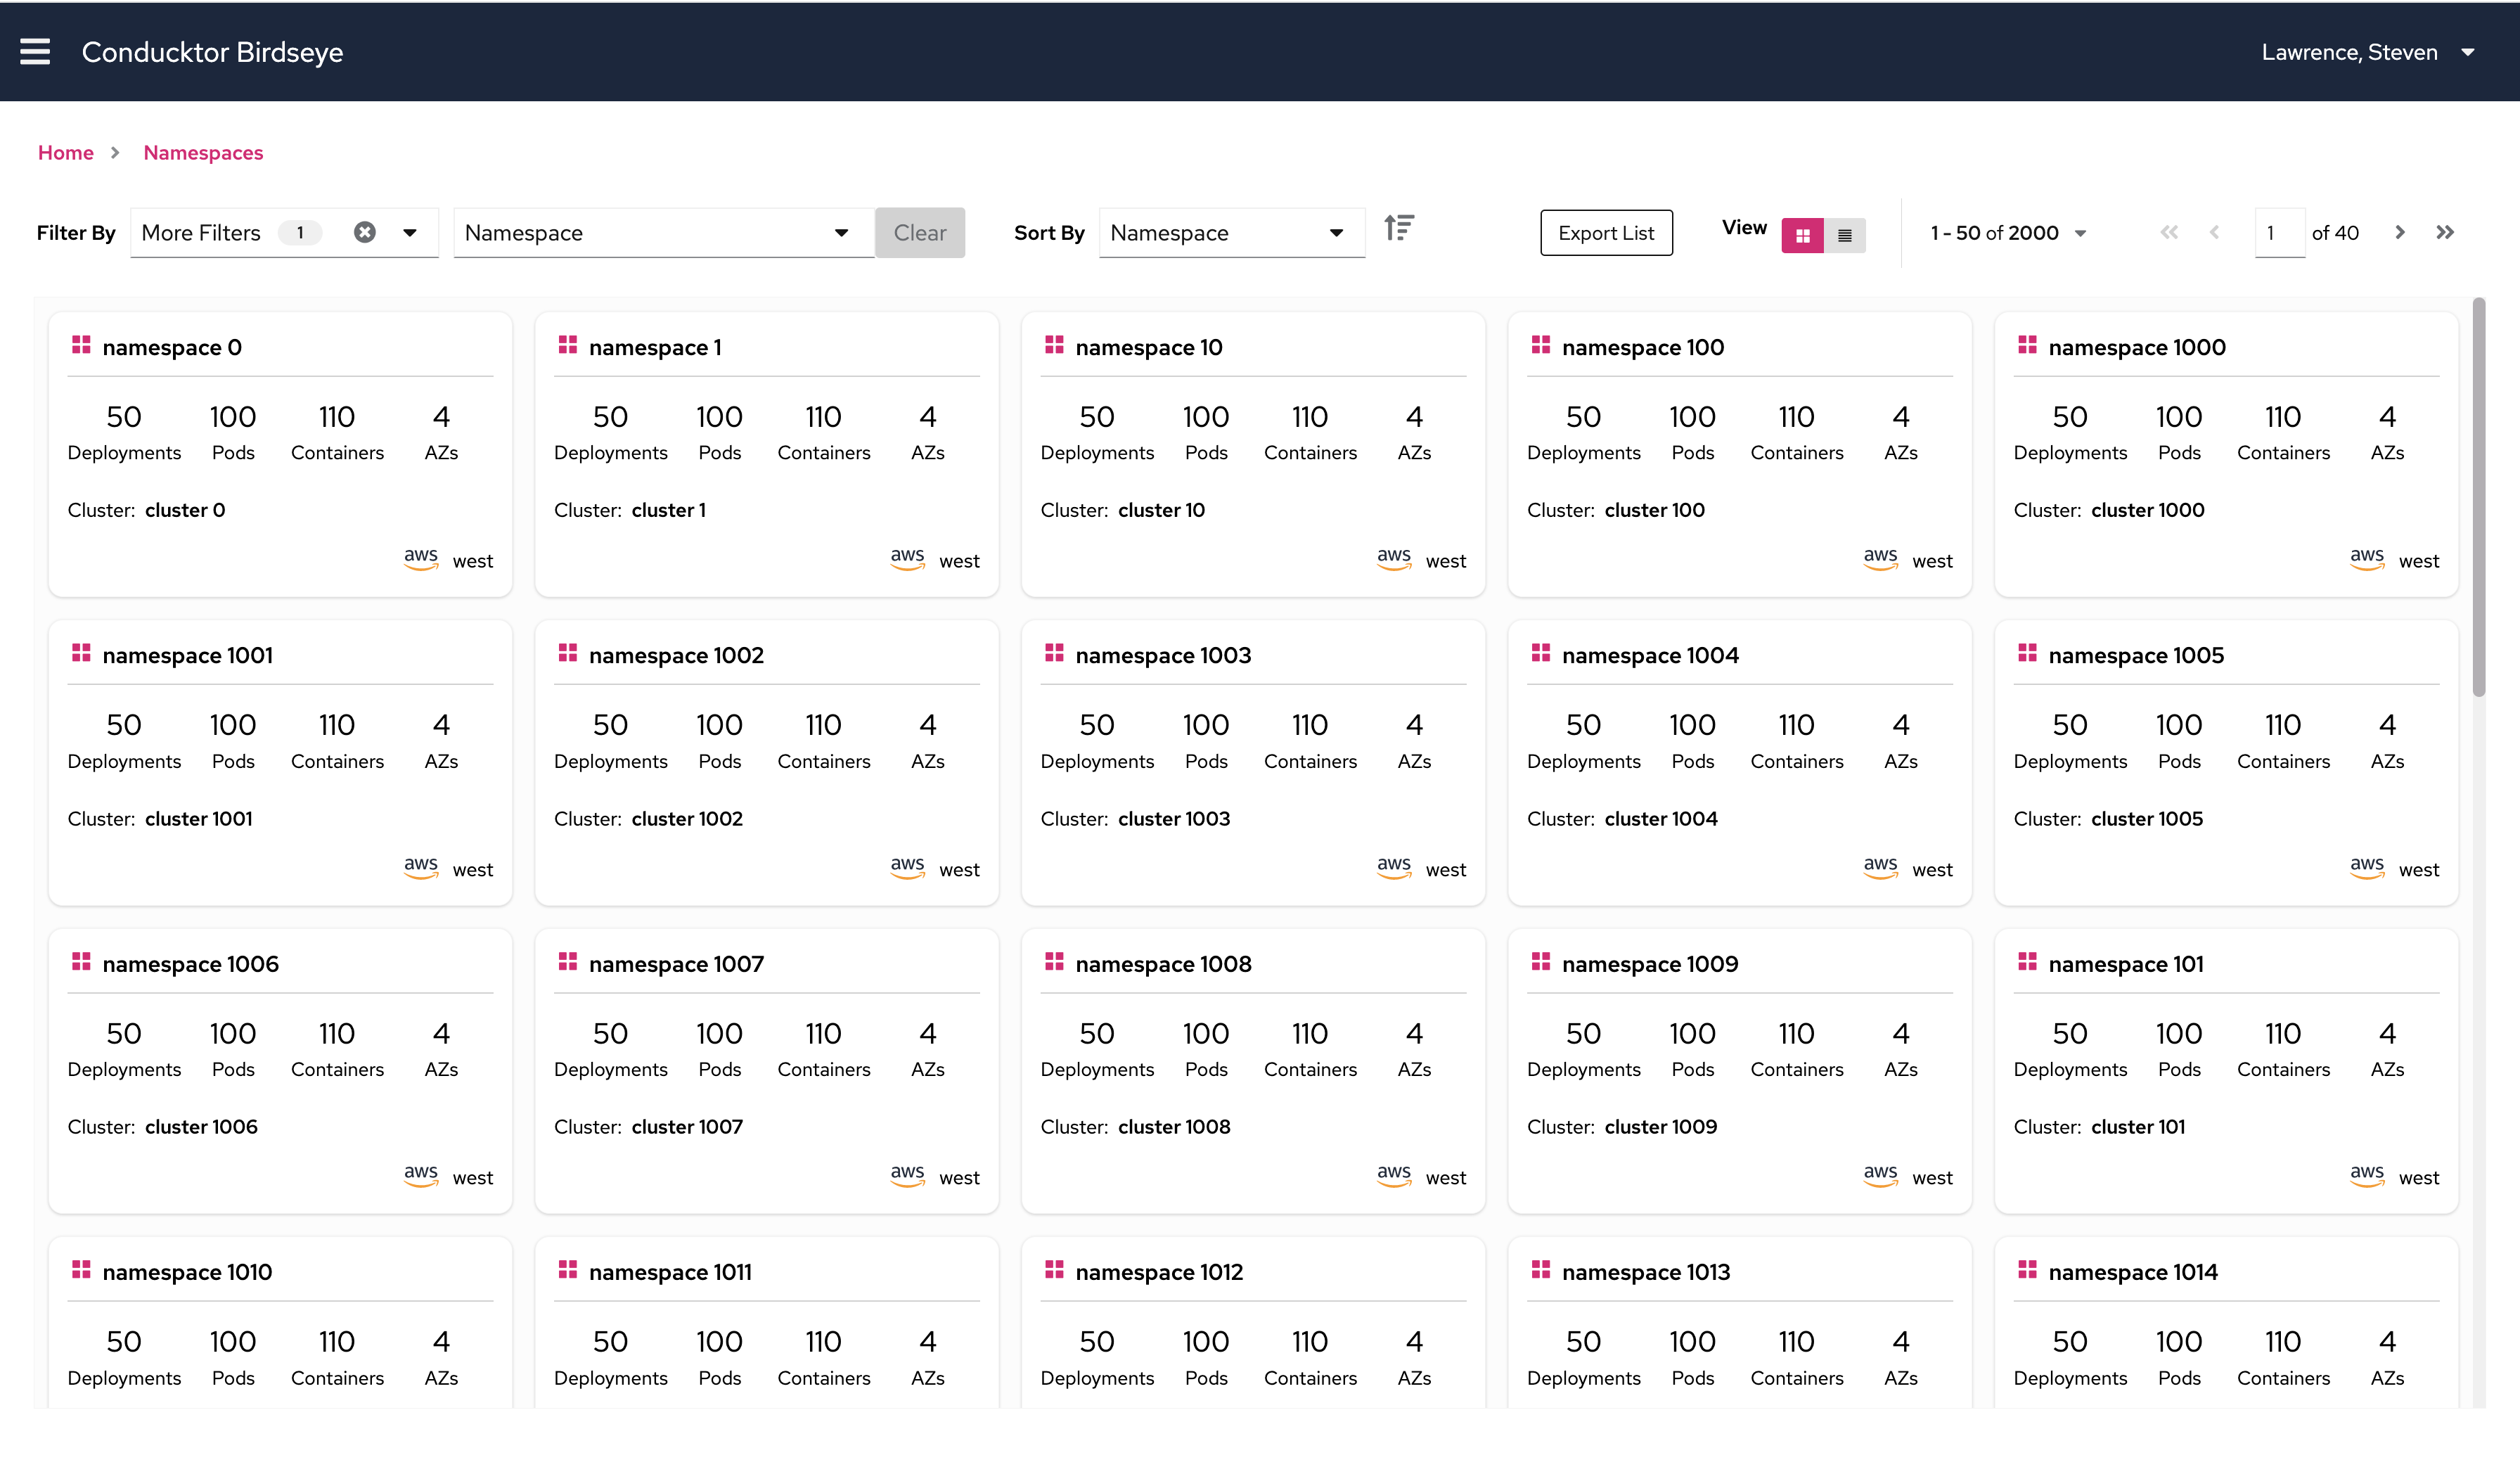
Namespace tile view which represents each namespace in a single tile.
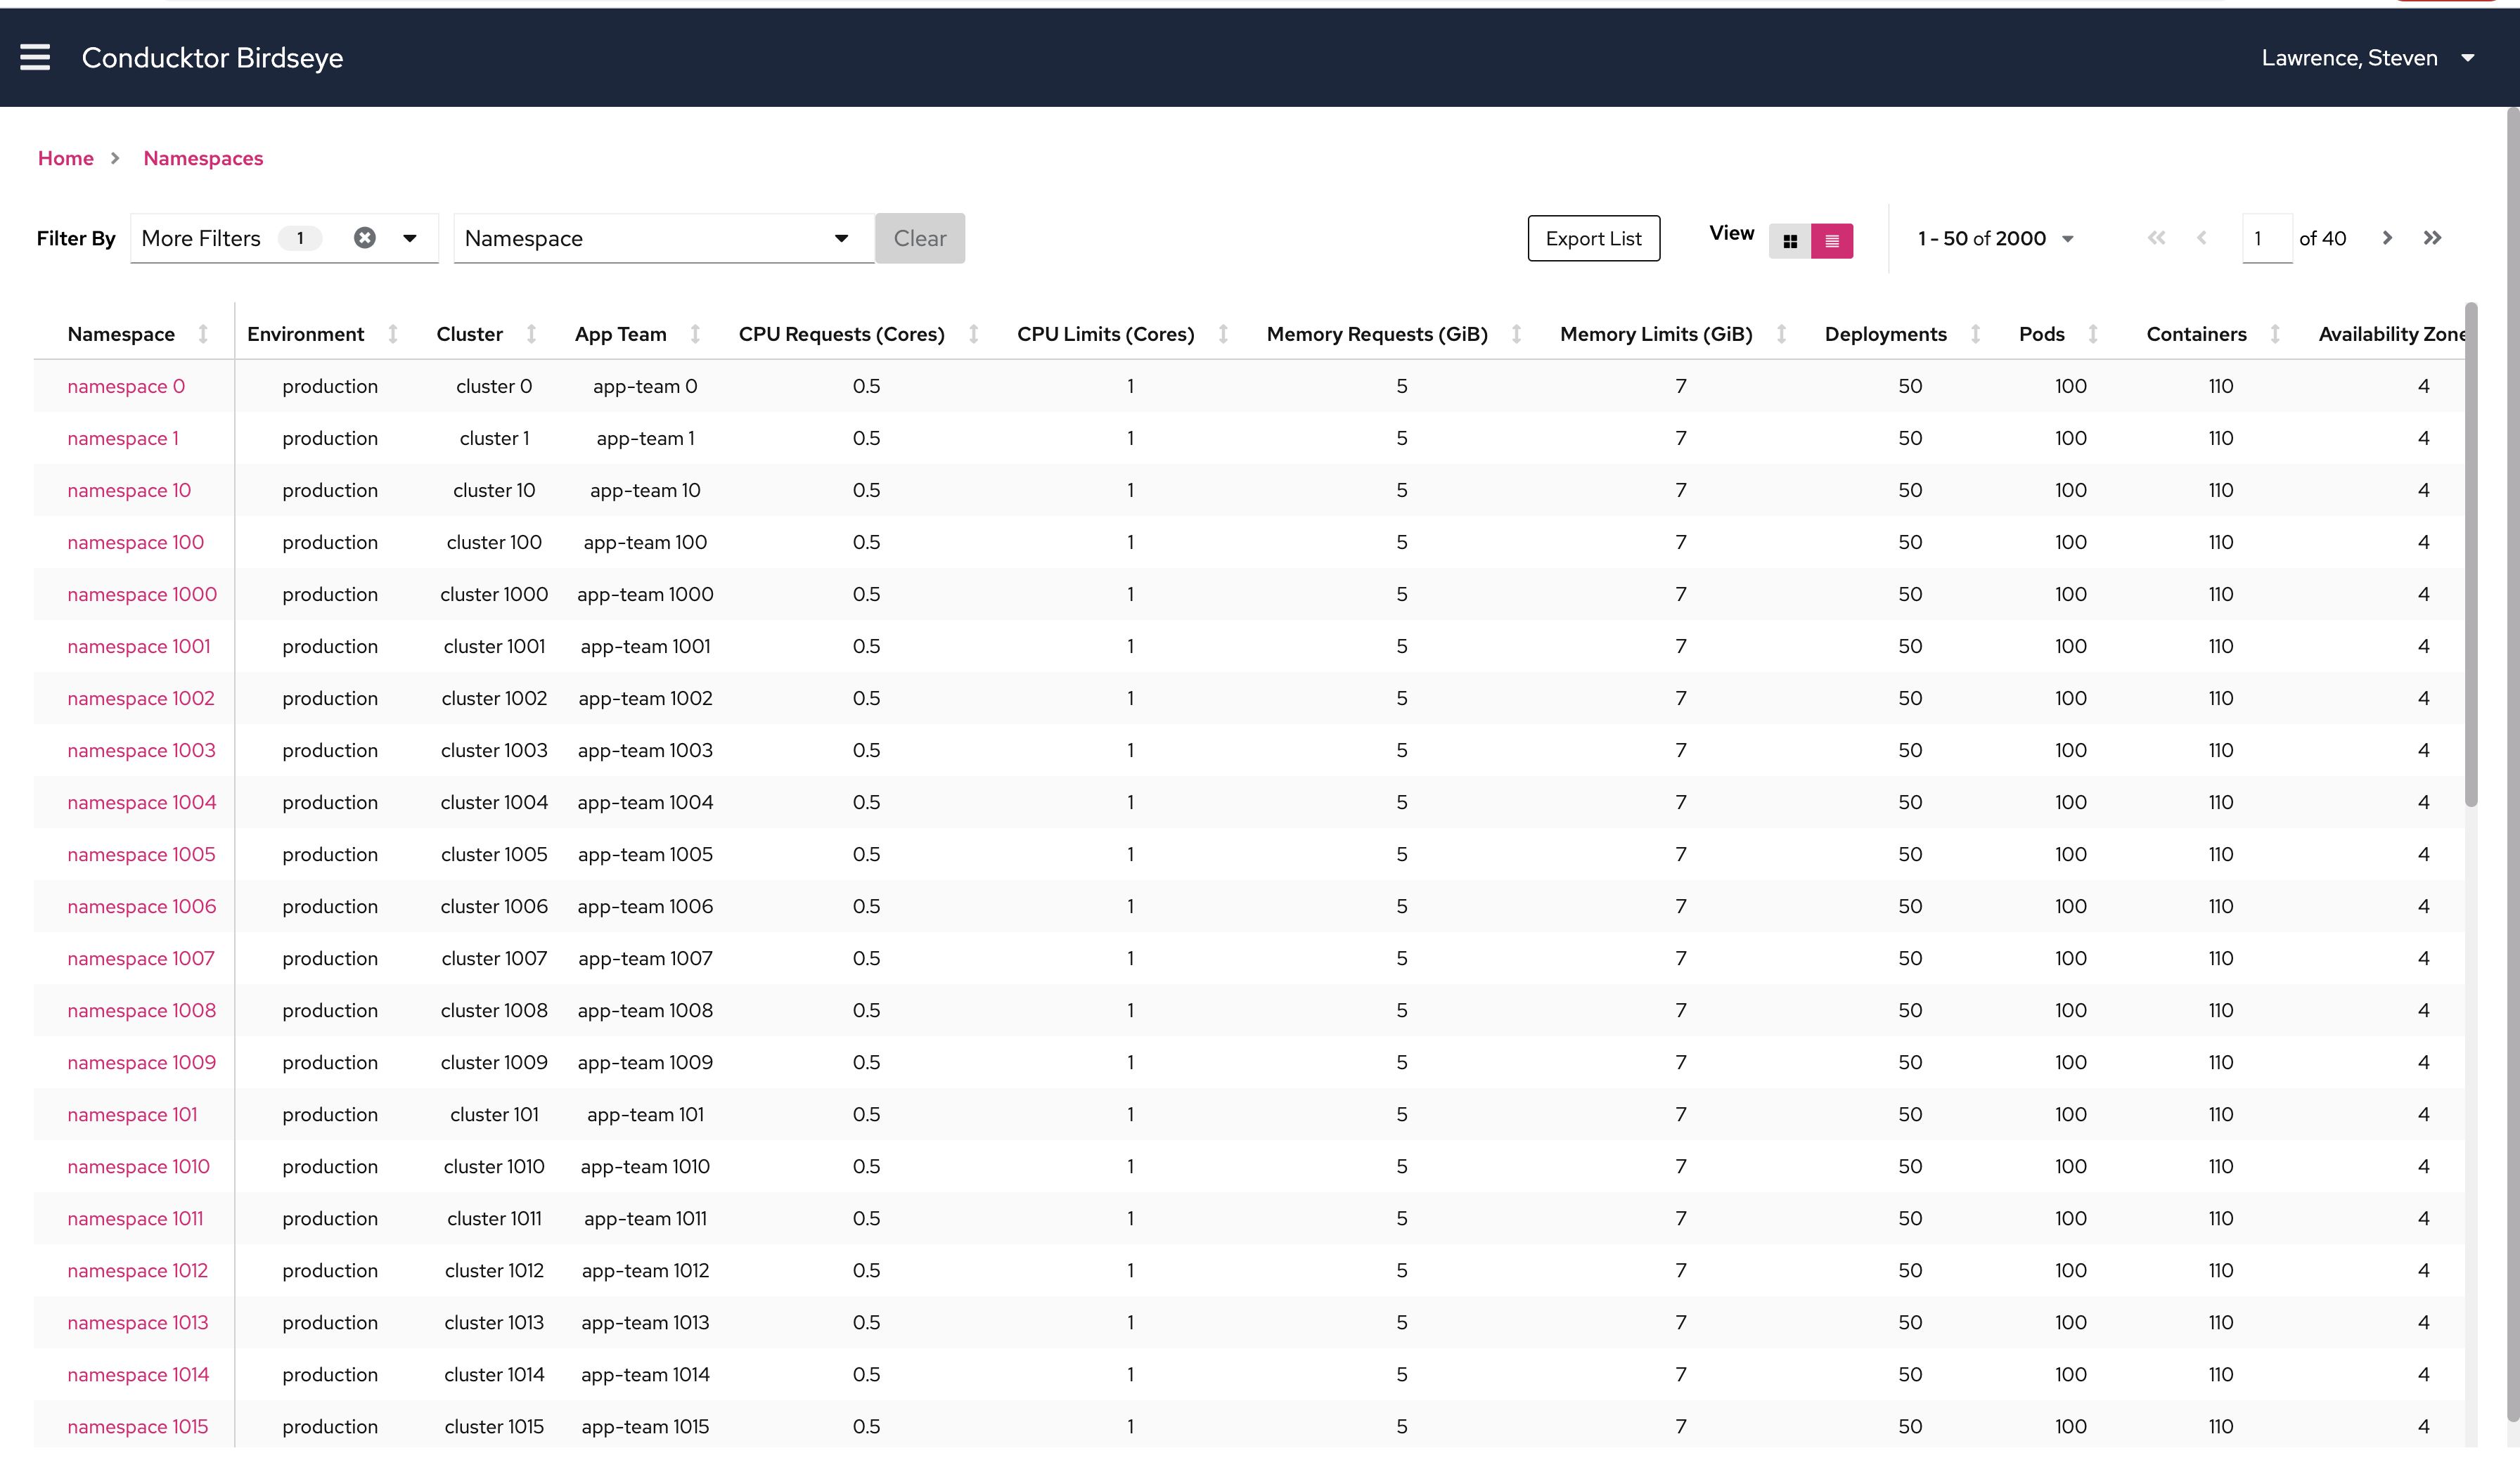
Namespace table view which shows metrics and data for all namespaces in a single table.
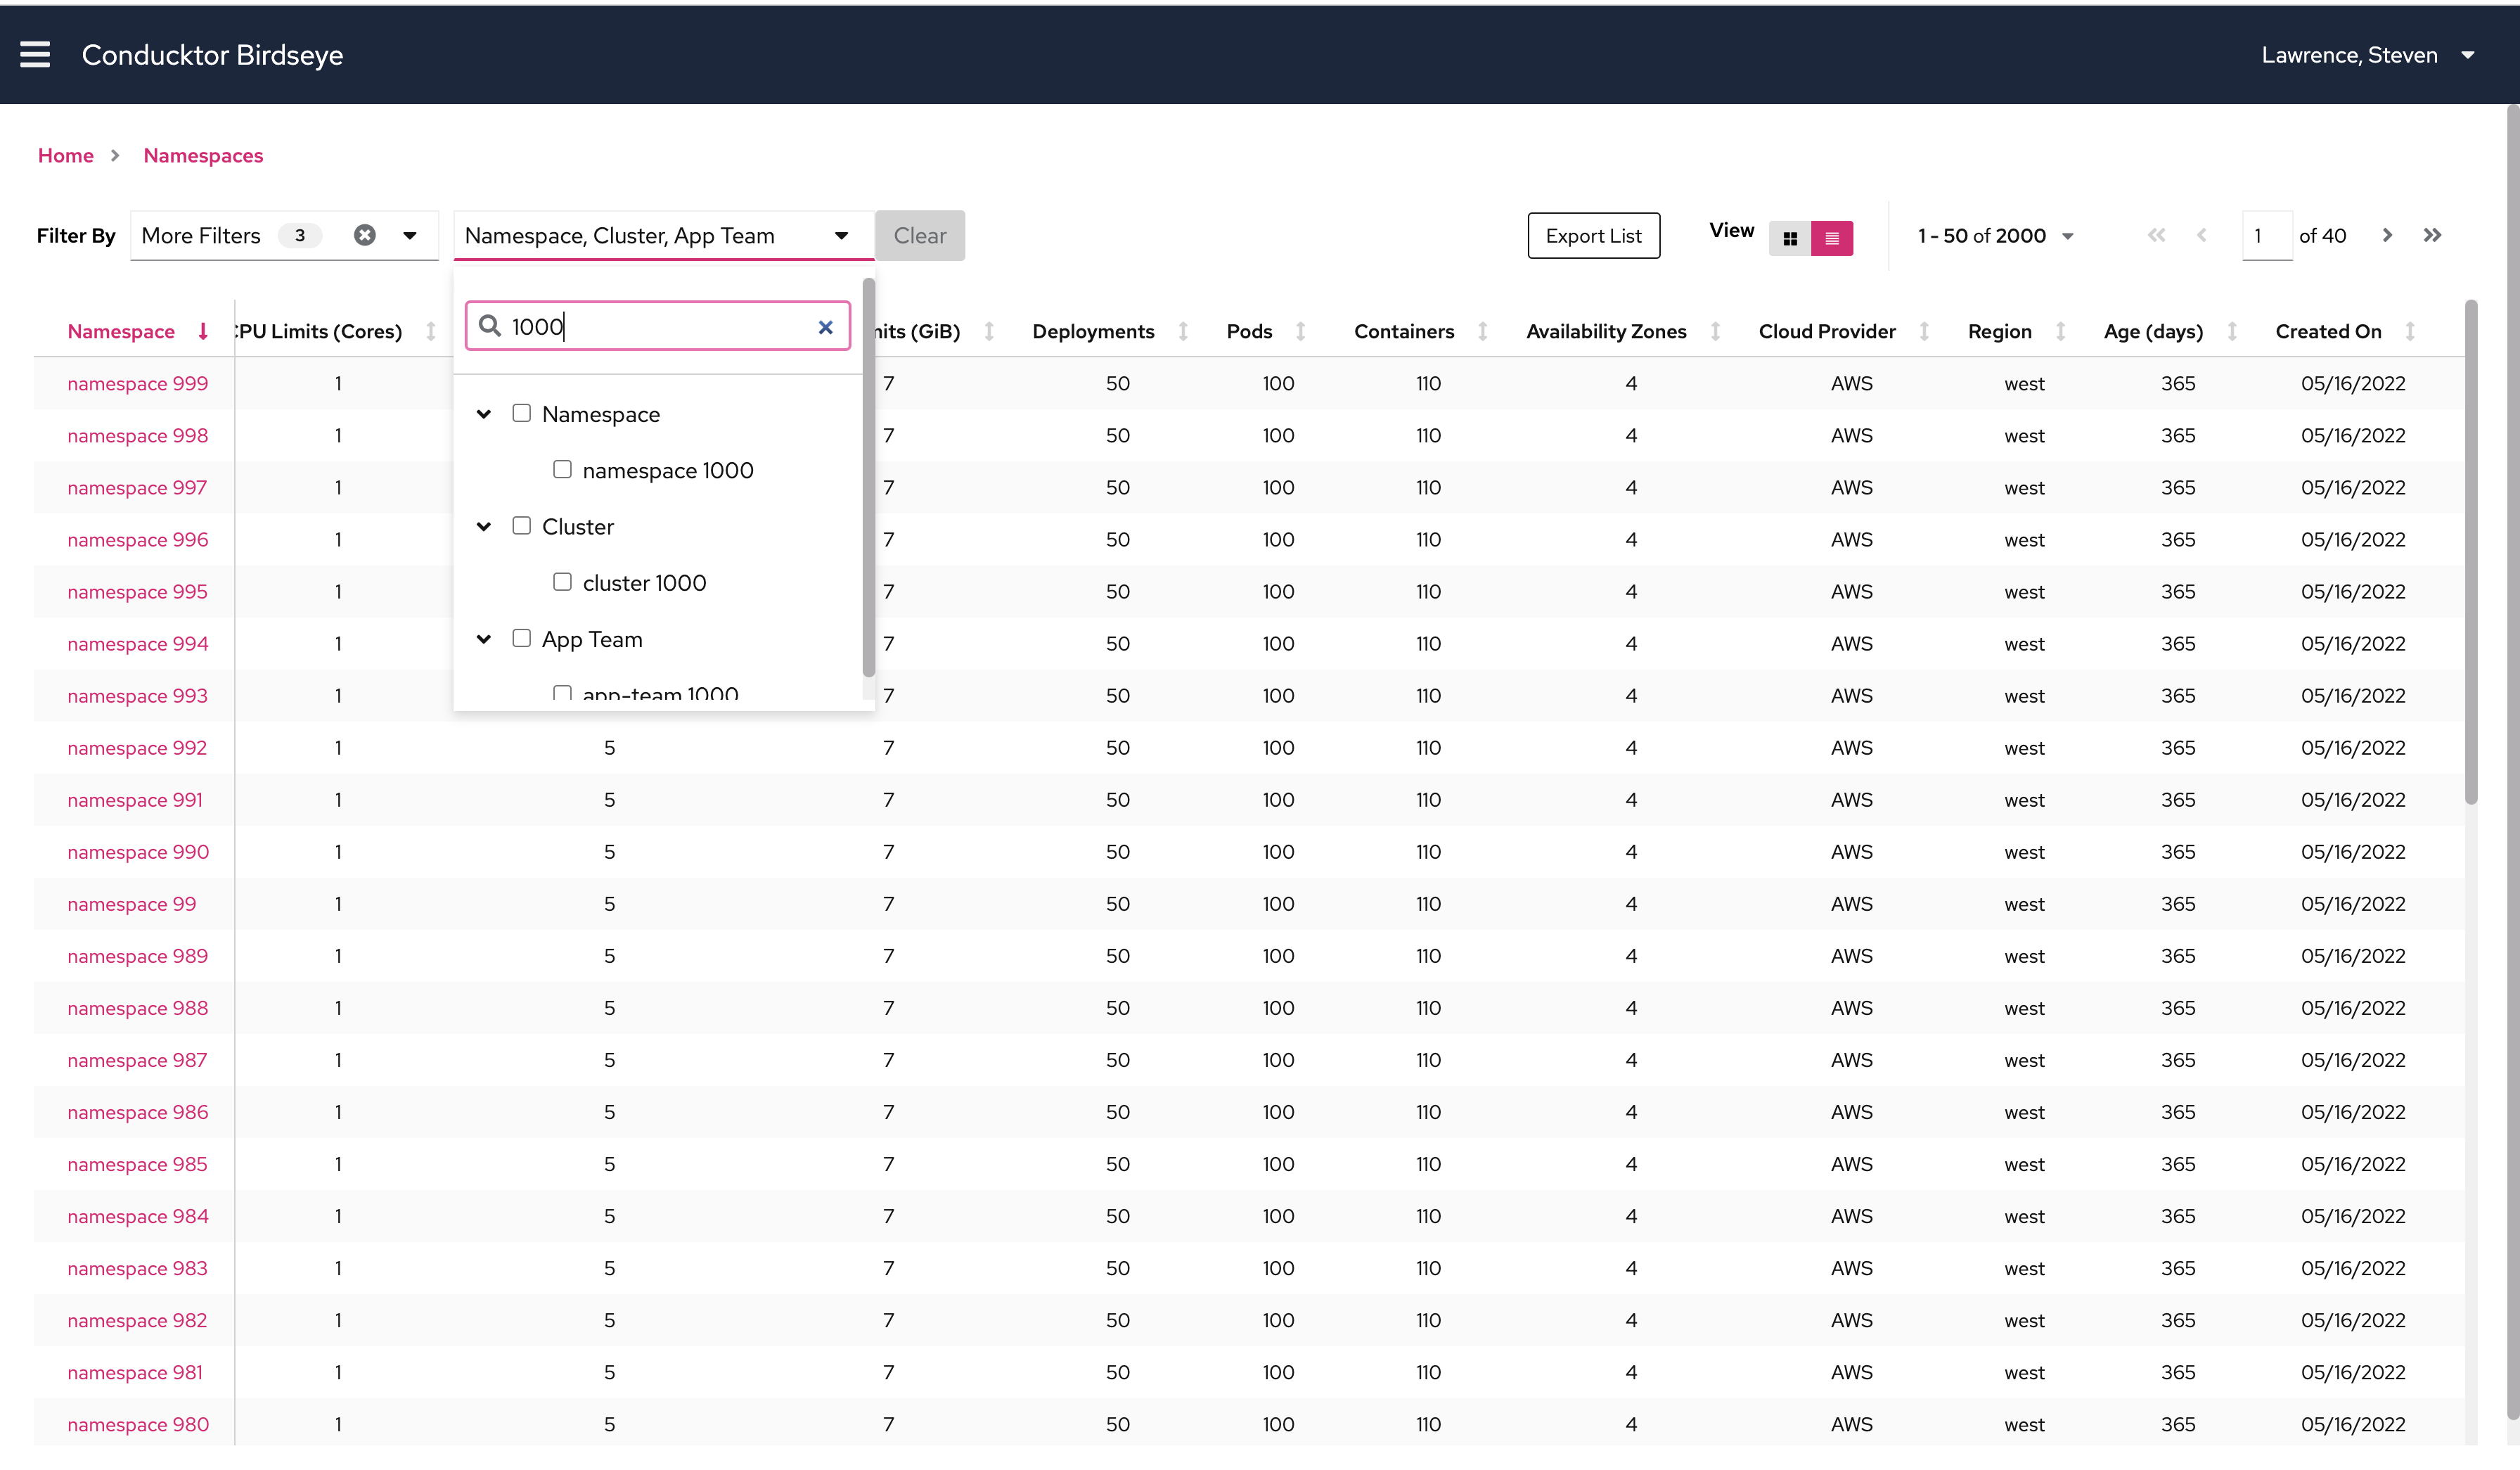
When users type to search for a filter, all the matching options will show
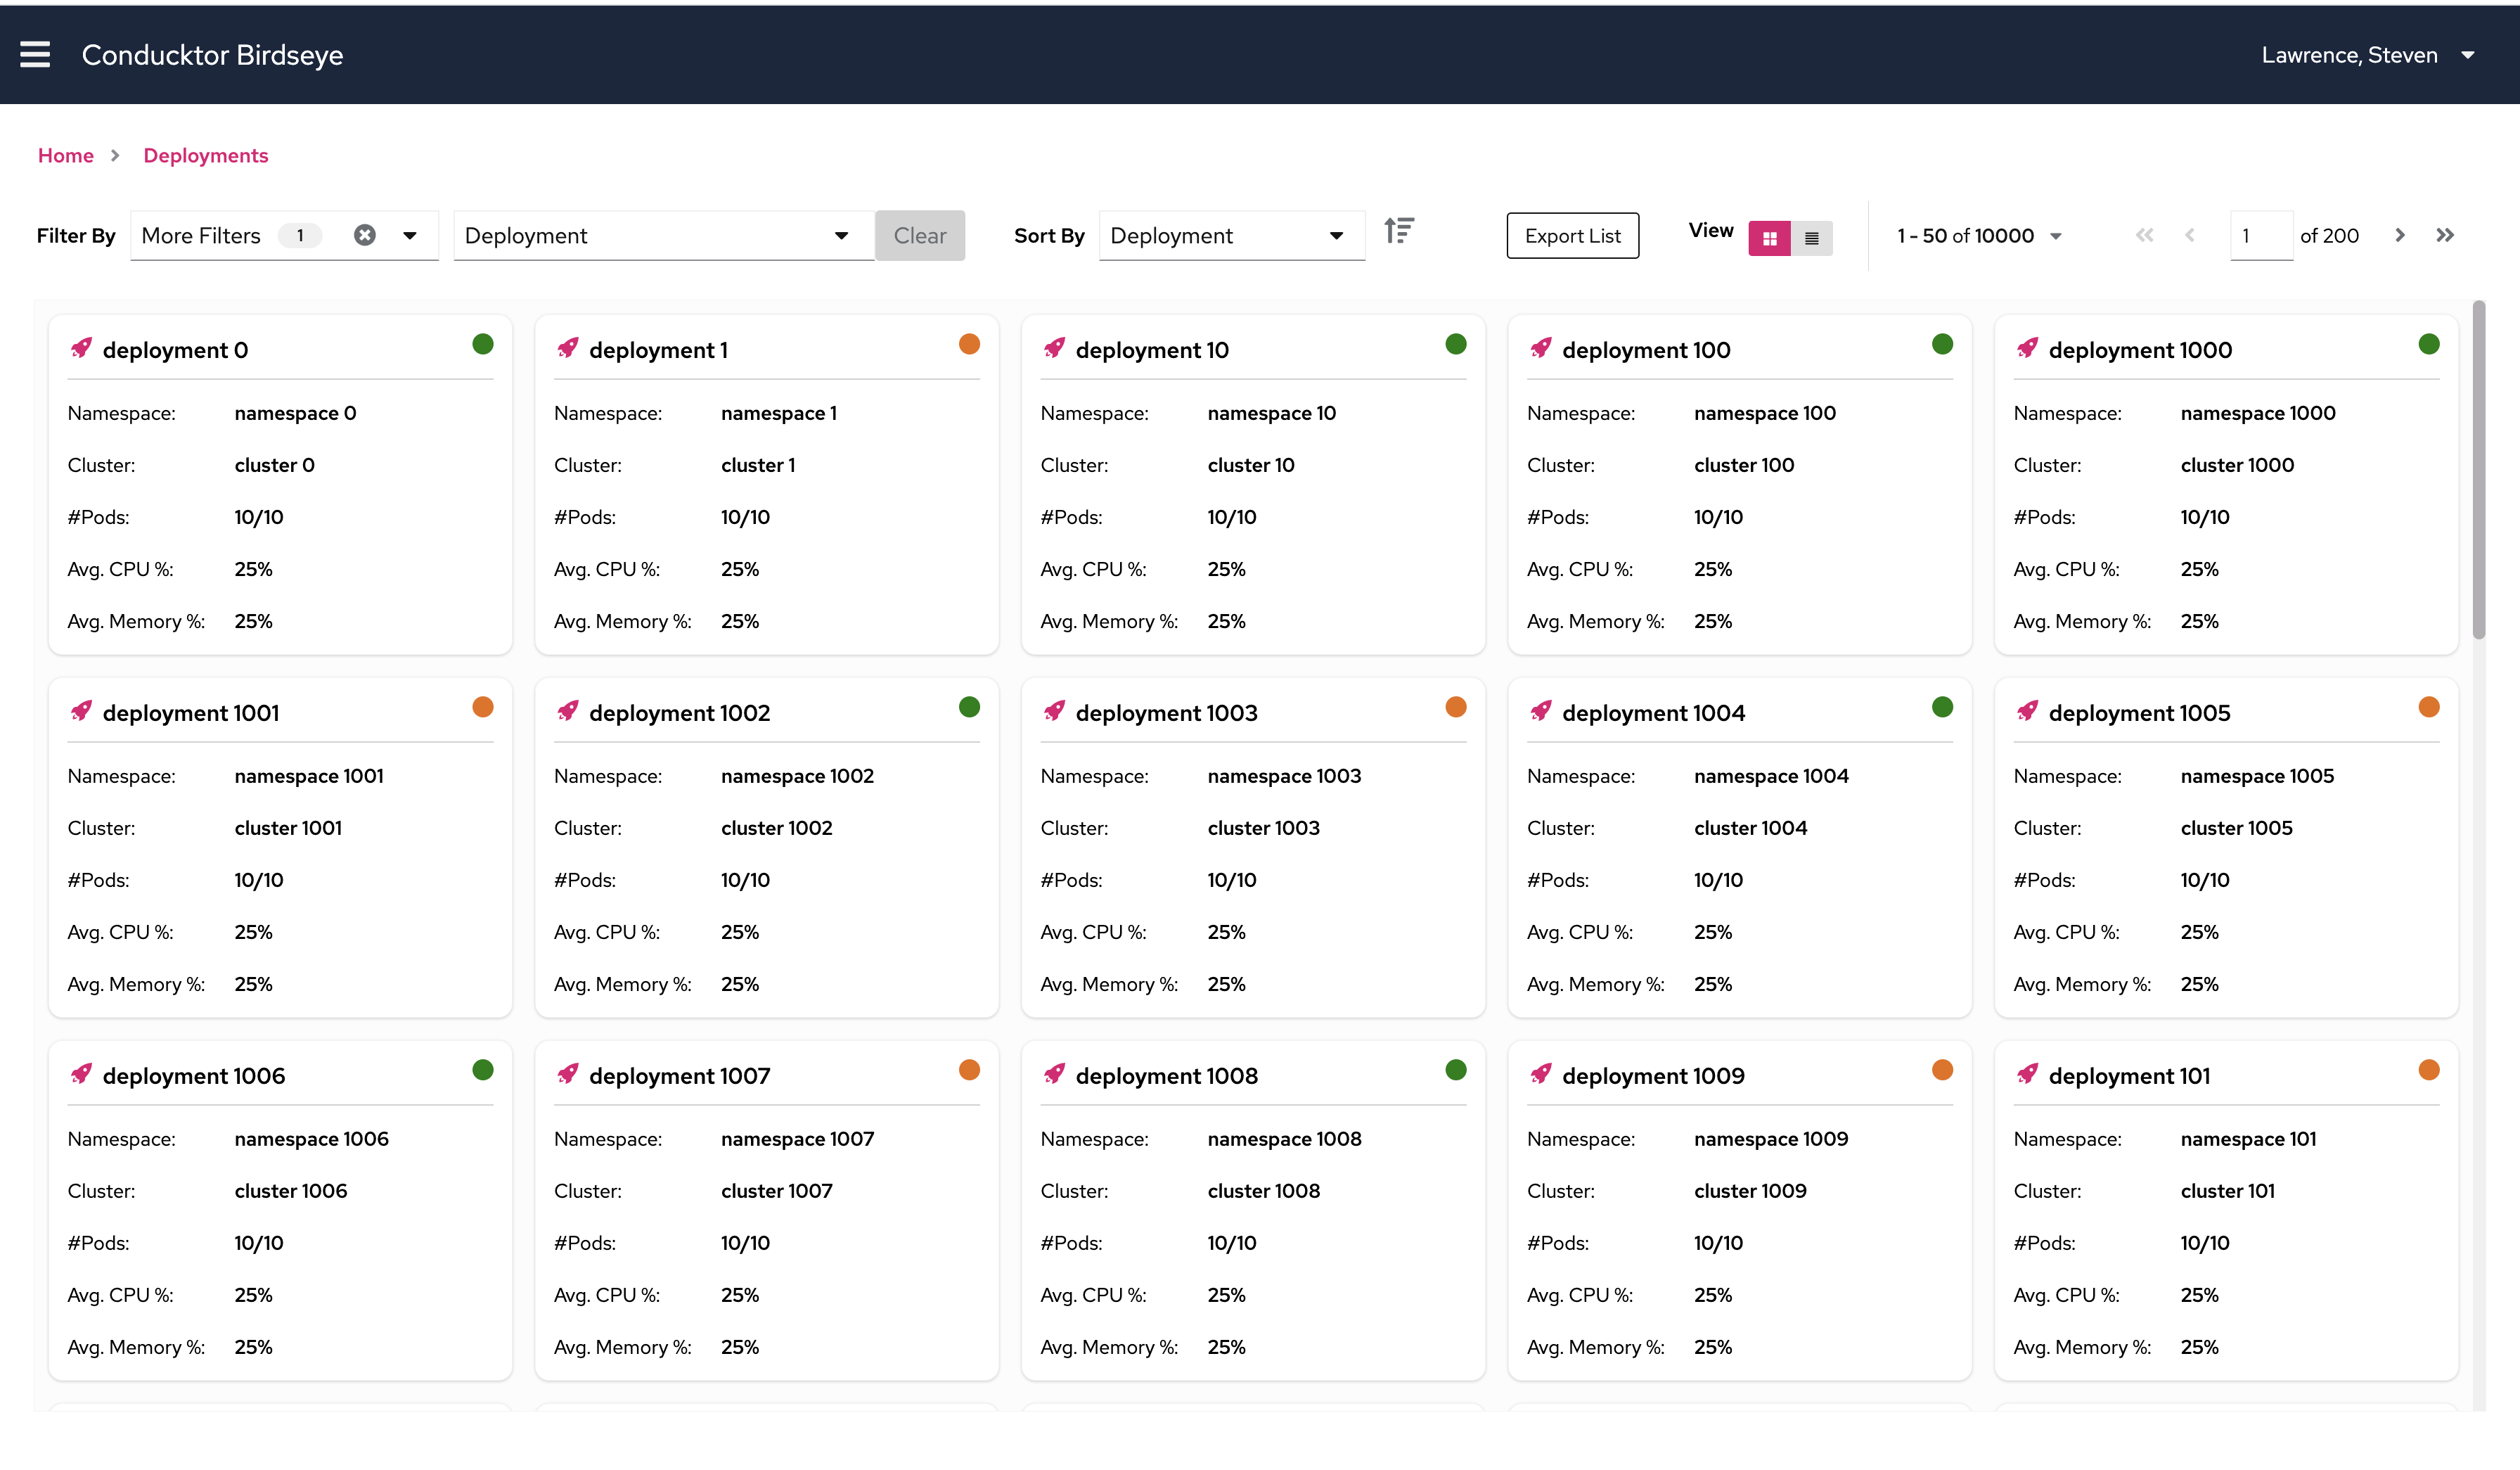
Deployment tile view which represents each deployment in a single tile.
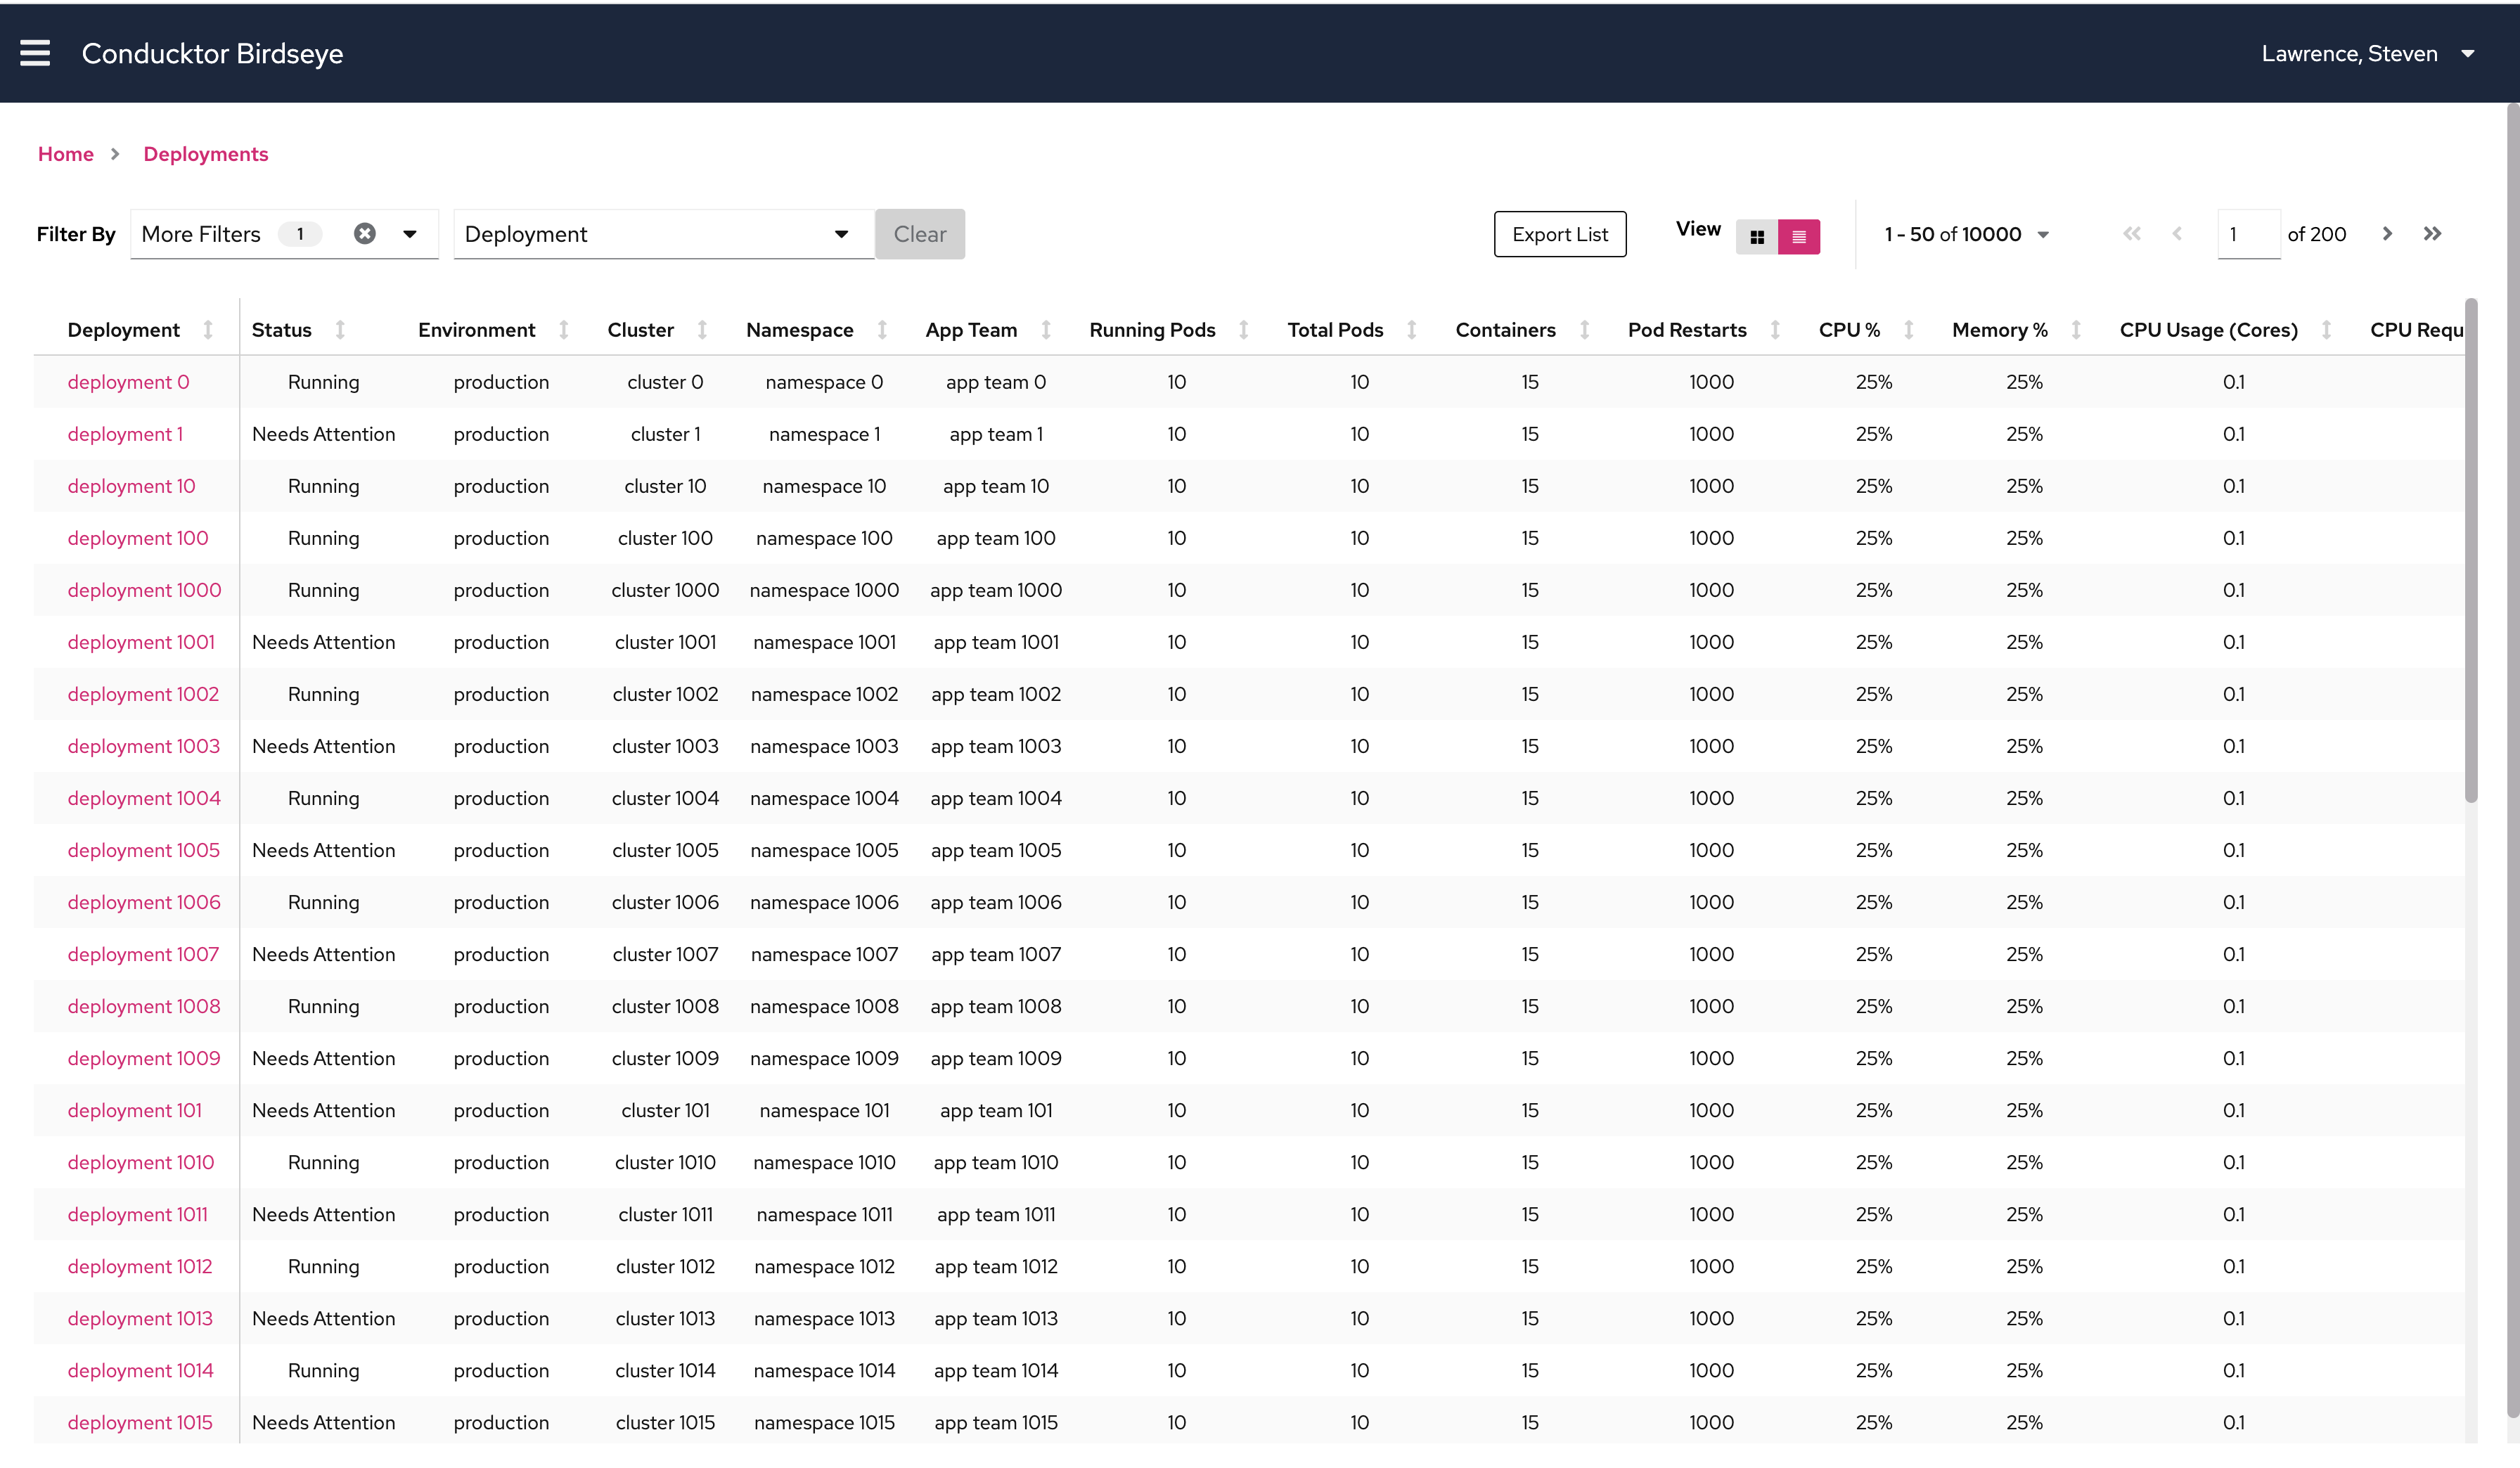
Deployment table view which shows metrics and data for all deployments in a single table.
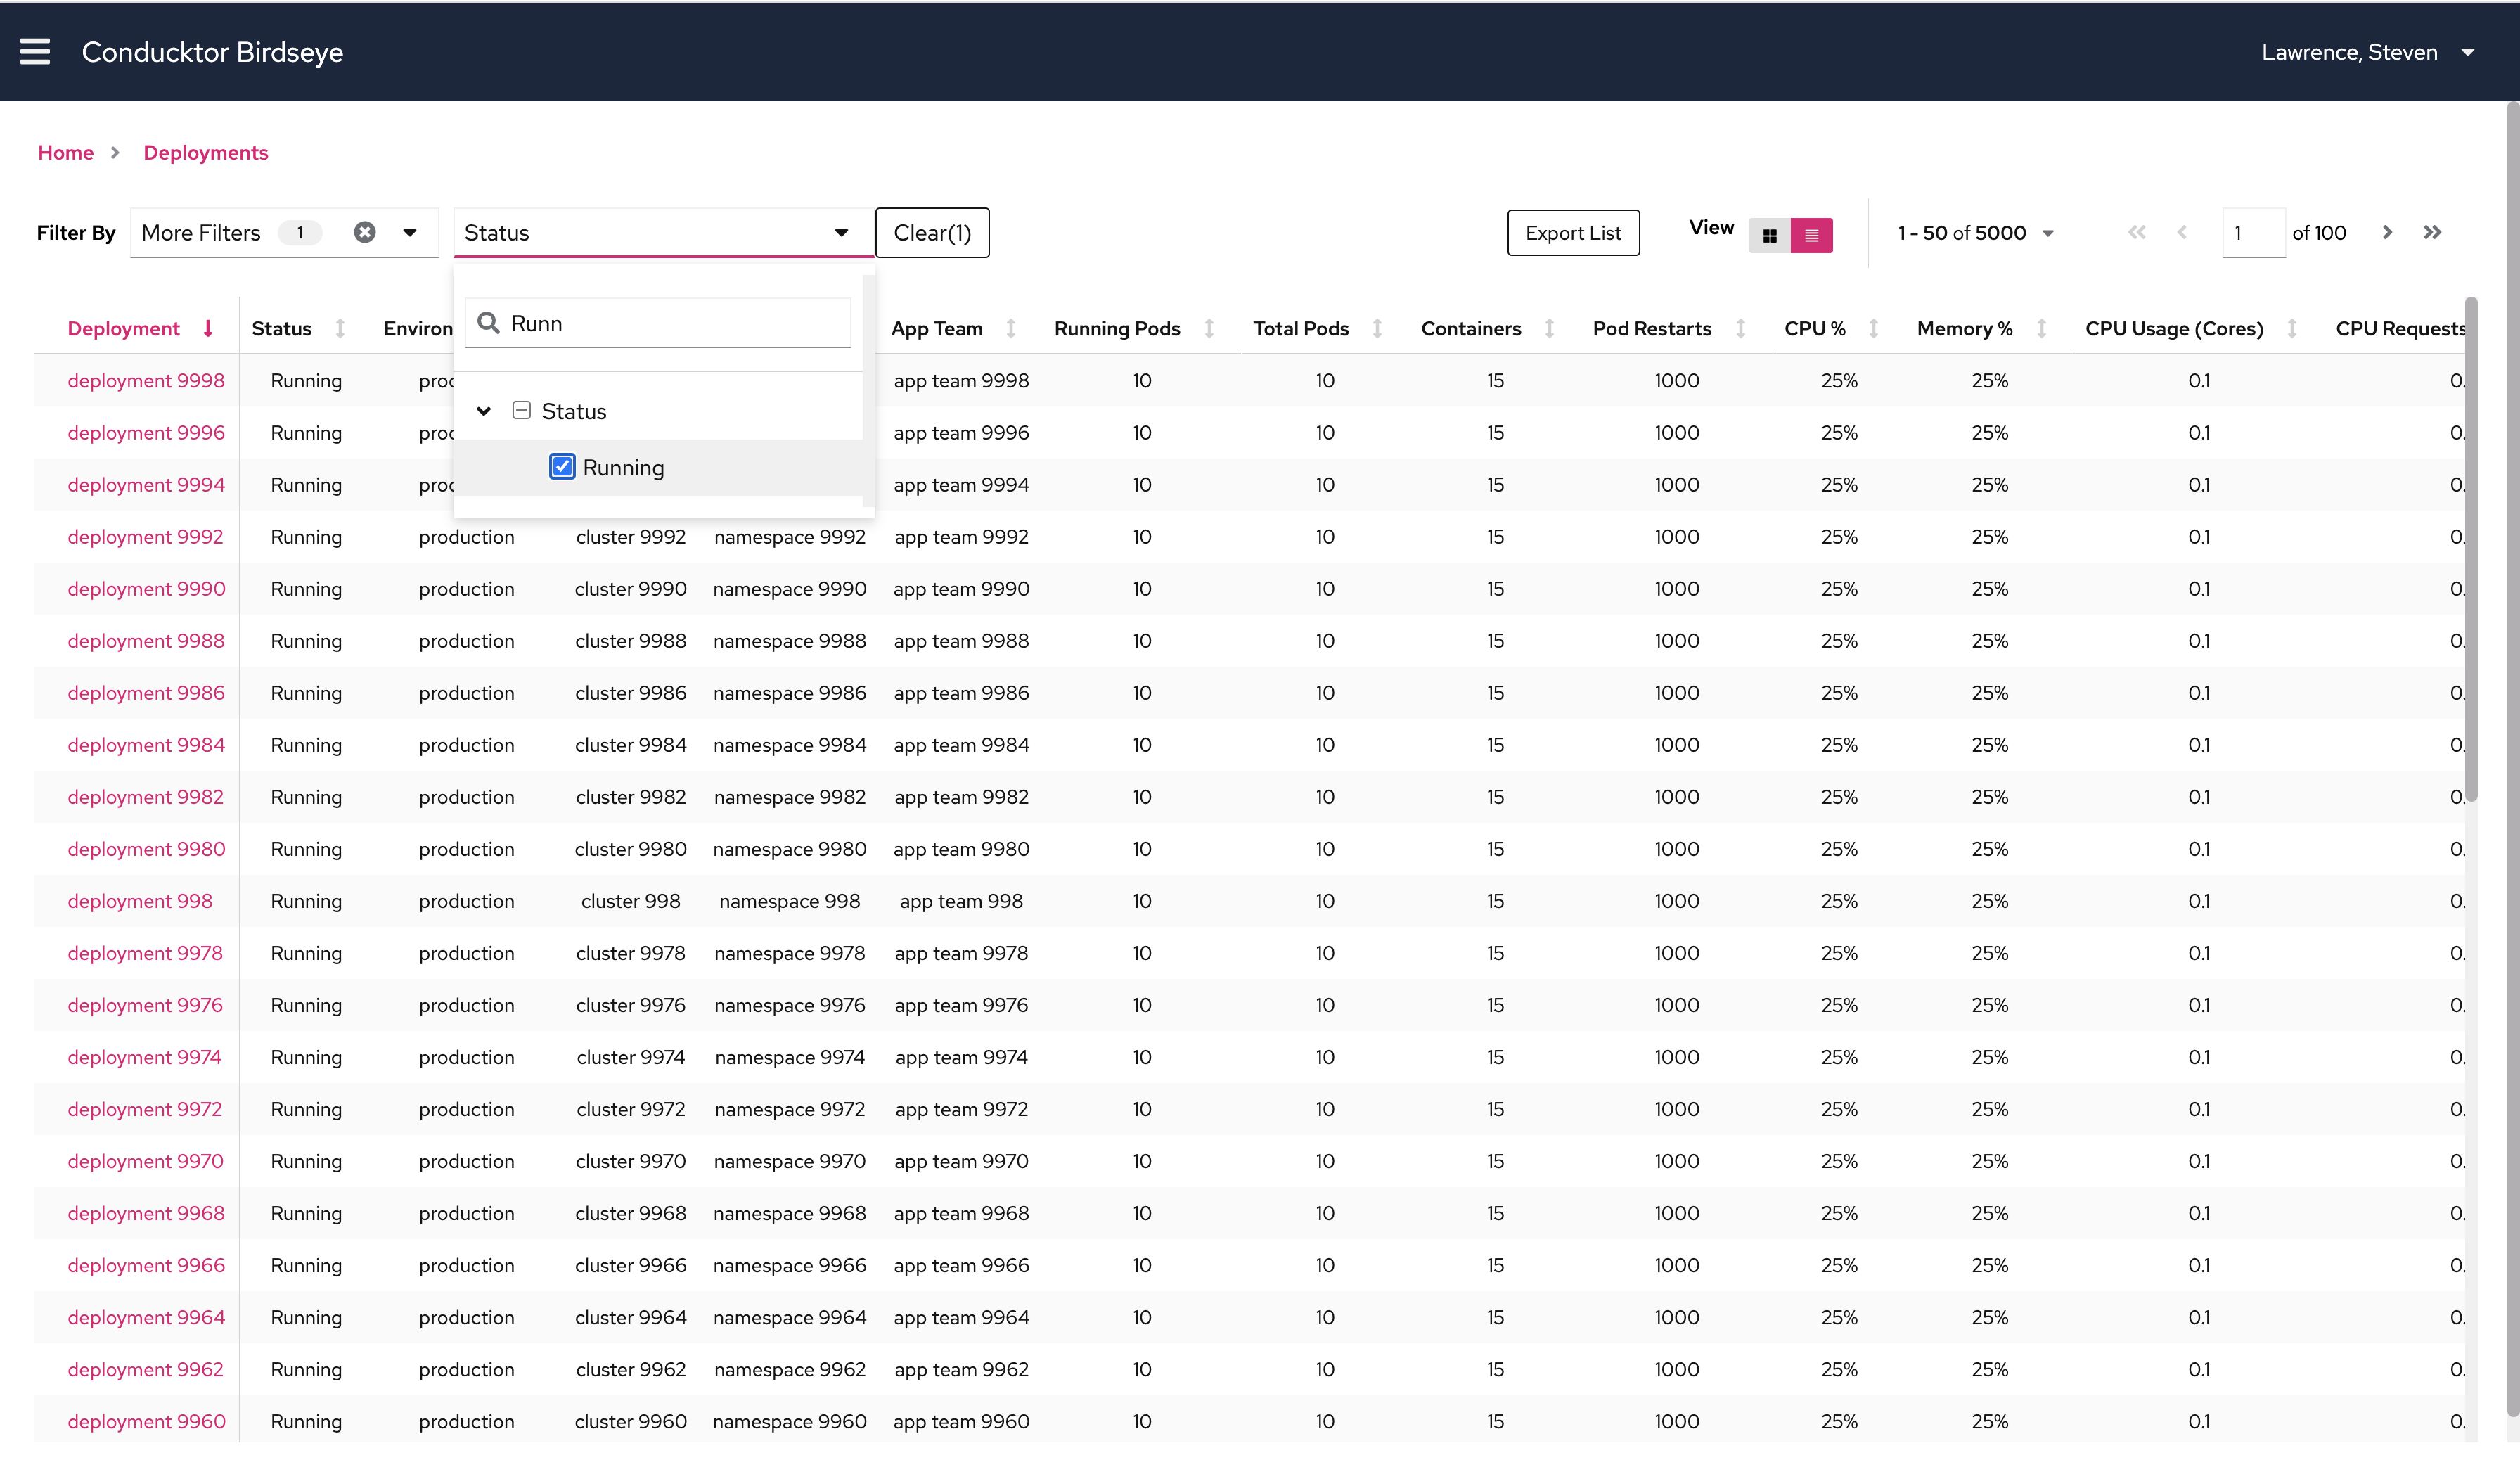
Using the filters to see only all the running deployments.
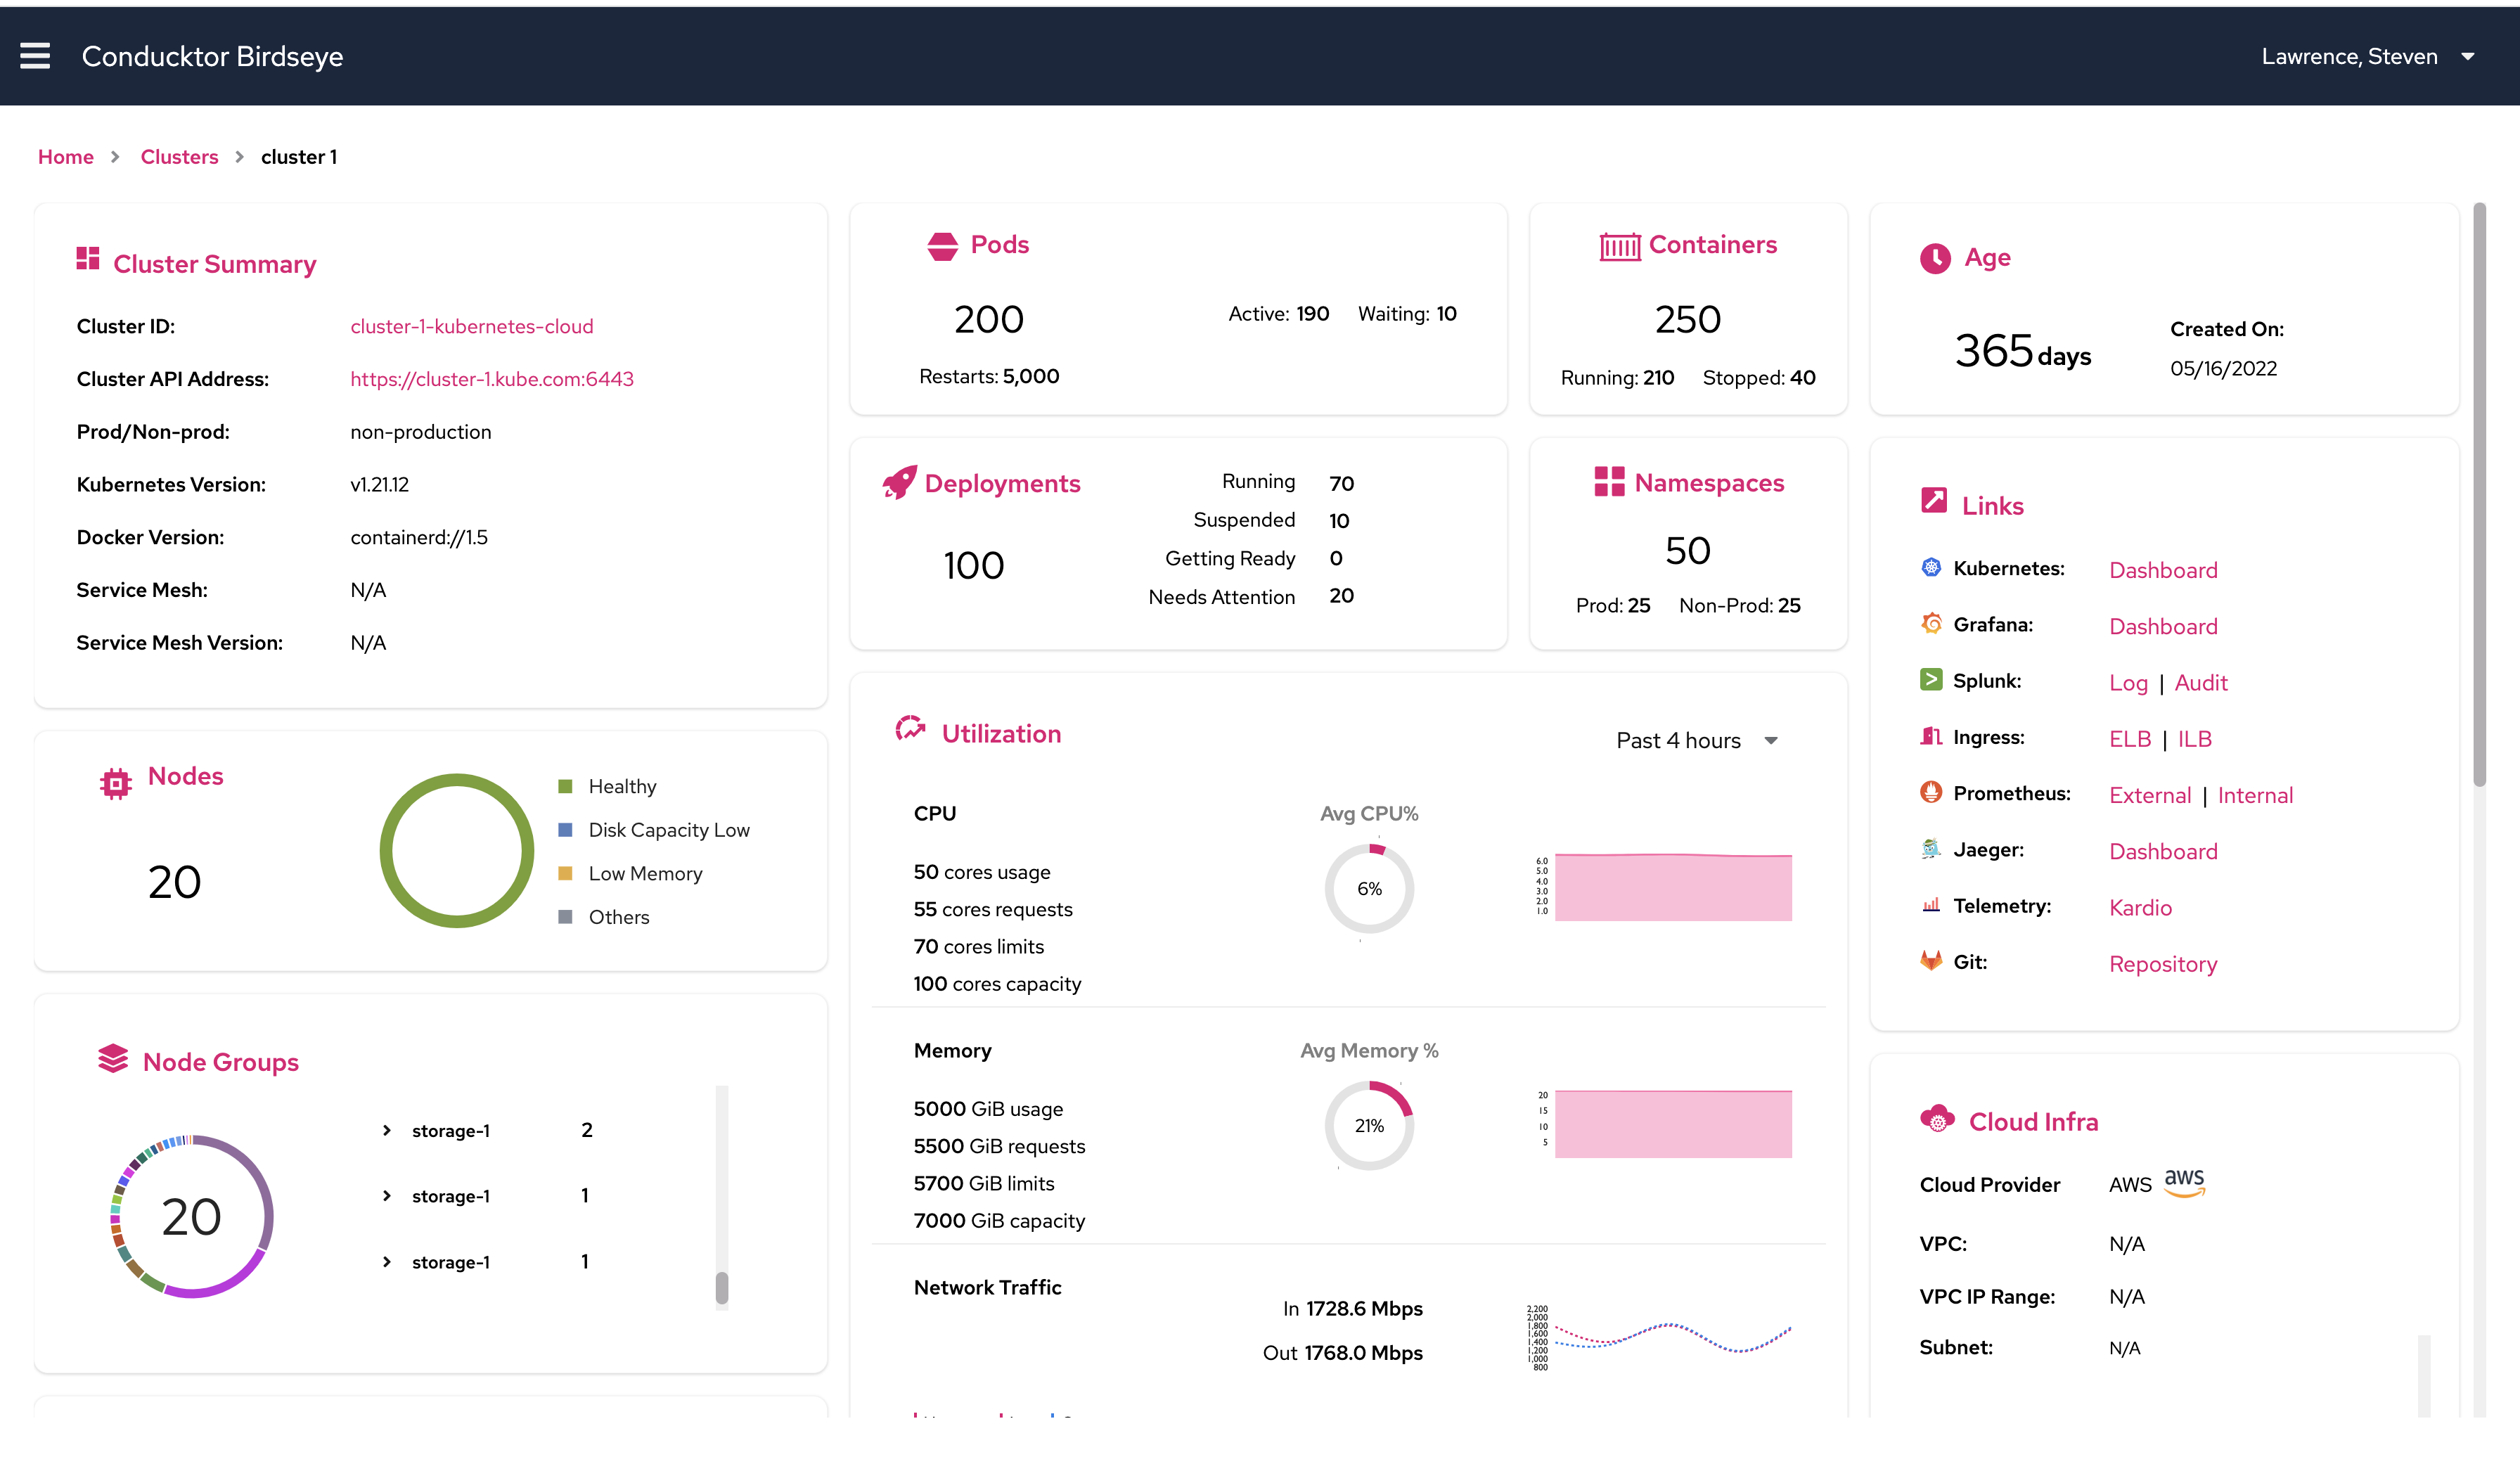
Cluster detailed view which shows more indentifying information, and more categorized metrics. There is also a tile with important links related to the cluster.
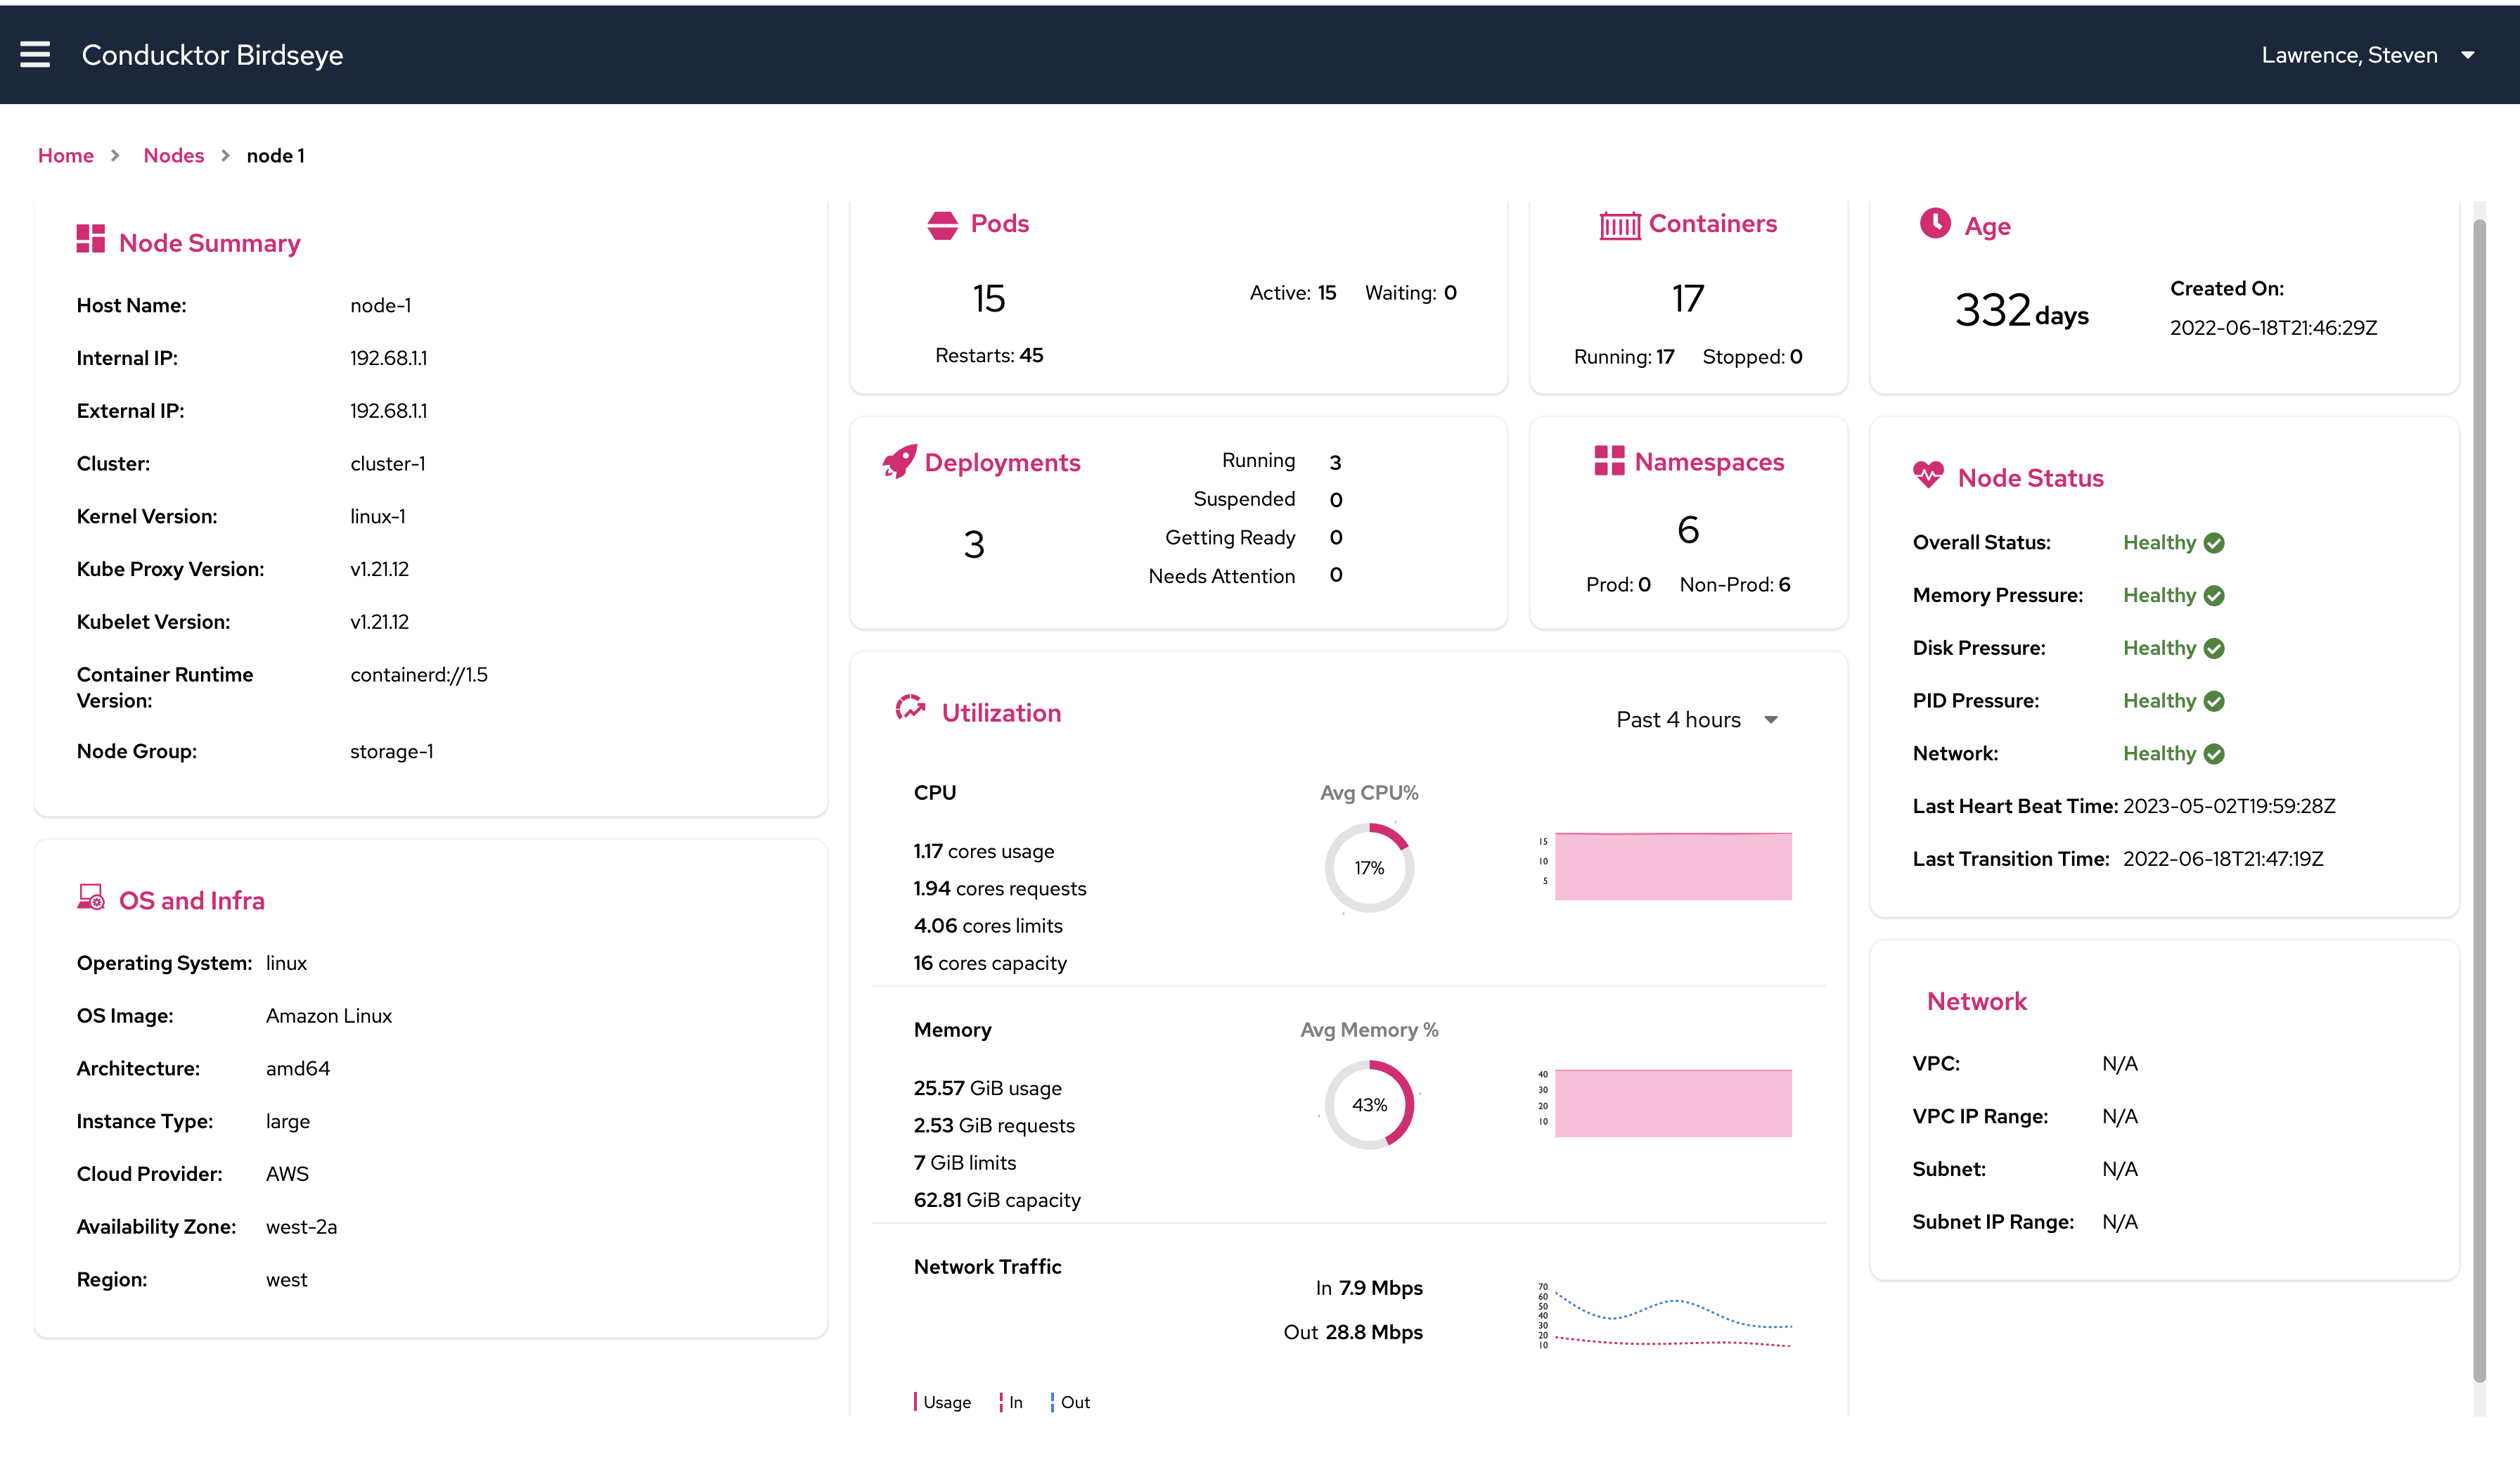
Node detailed view which shows more indentifying information, and more categorized metrics. There is also a tile with data regarding the OS of the node.
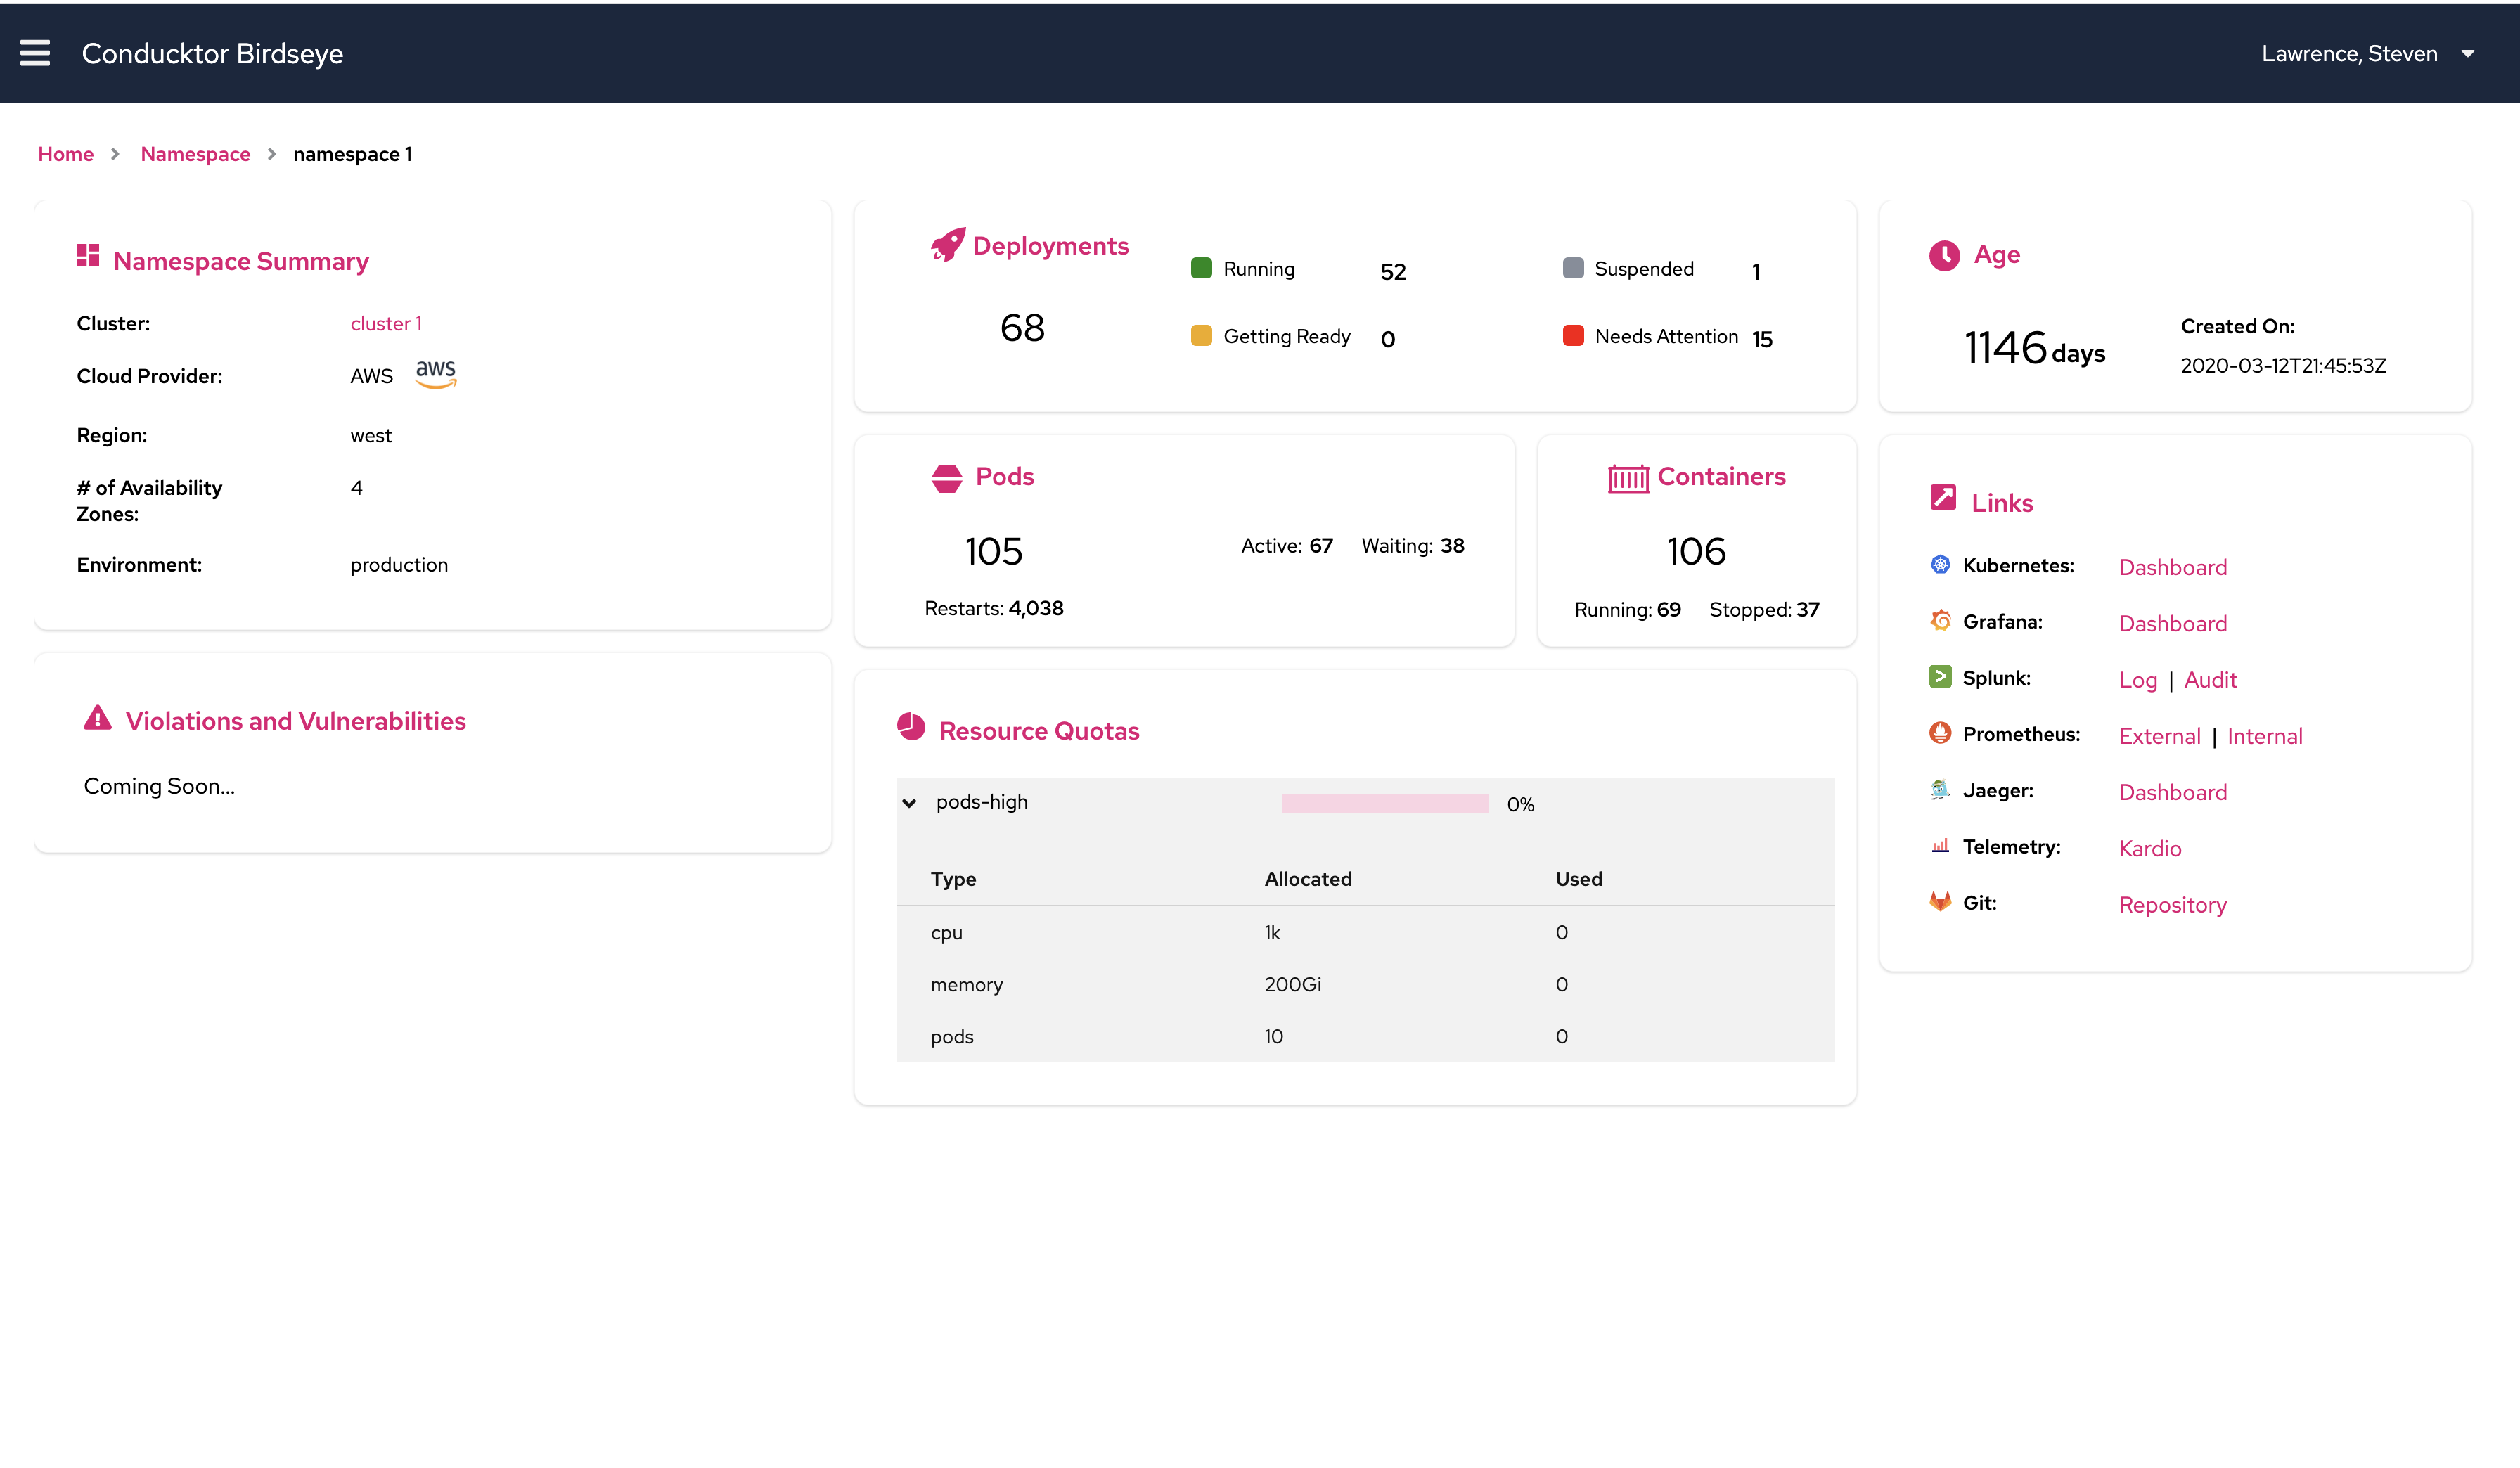
Namespace detailed view which gives a more specific overview of the namespace. This view has a links tile to important links for the namespace.
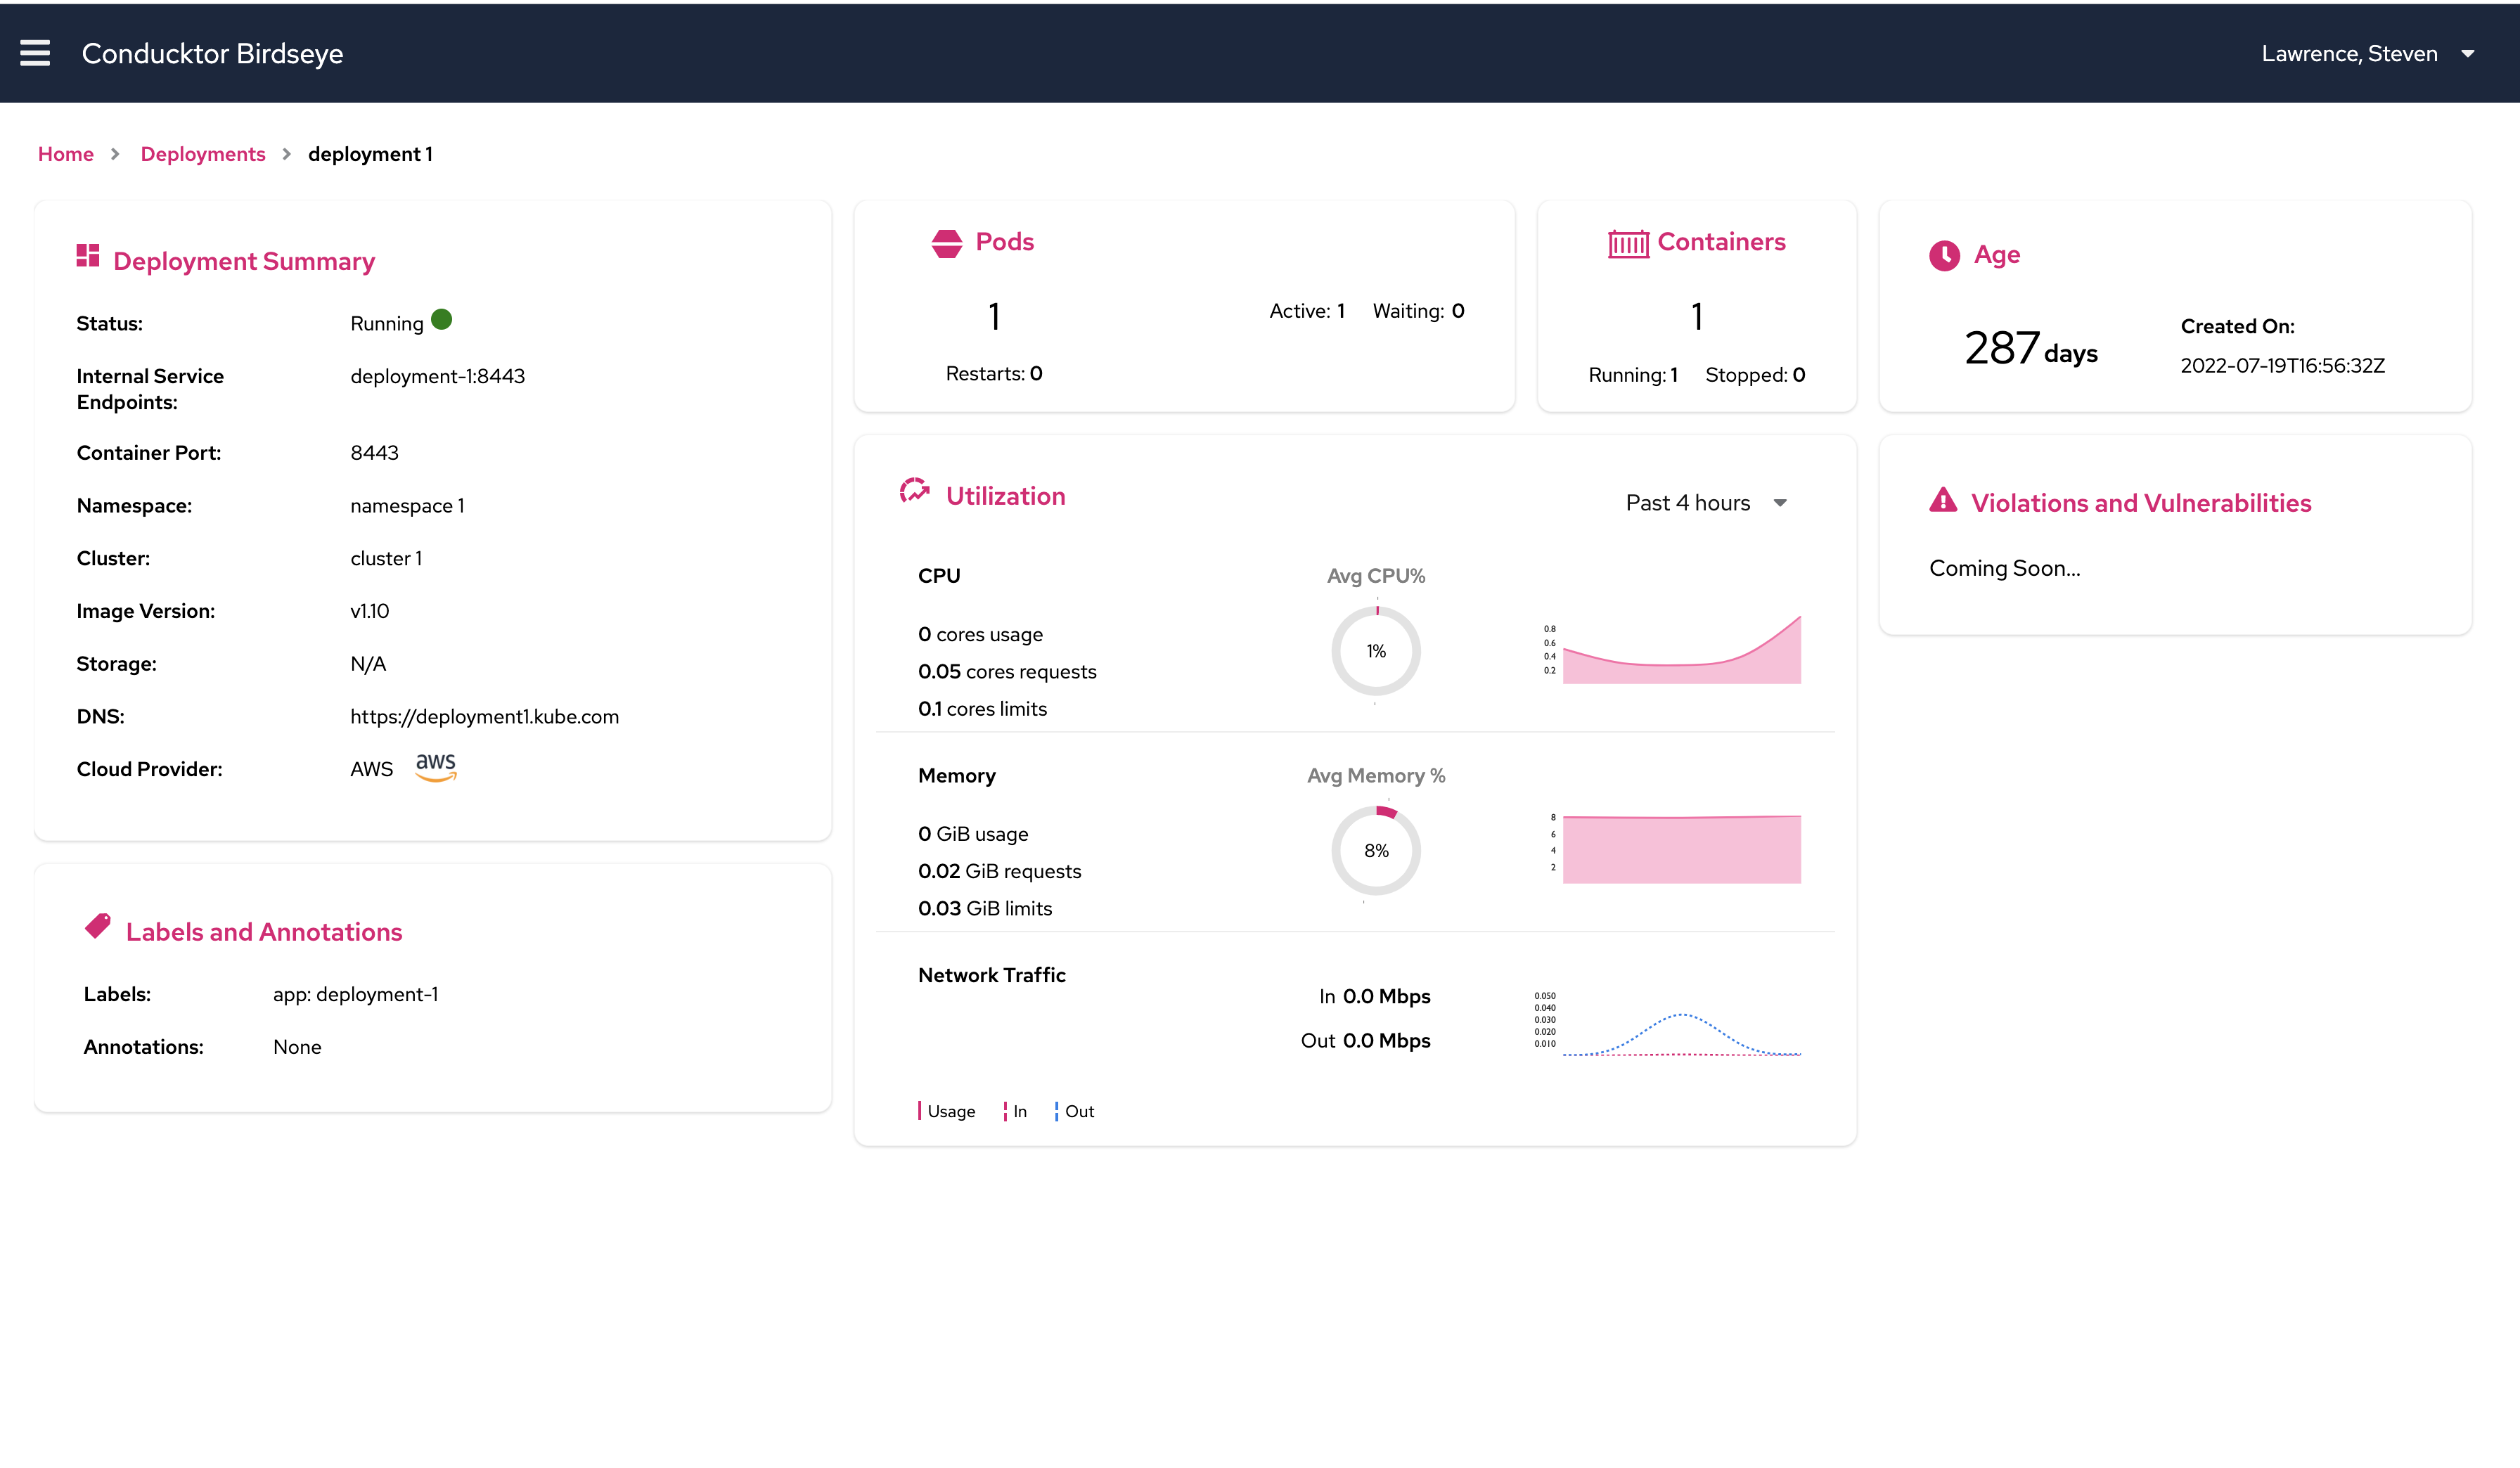
Deployment detailed view which gives more identifying information about the deployment. If the deployment has a DNS, then that is listed here too.